Setting up Alerts in Kibana
Introduction
Since VQCM includes version 8 of Elasticsearch, Kibana includes the new alerting feature.
It allows you to monitor your analytics data and take actions (like sending emails) based on conditions you can define and customize. This allows you to send notifications by integrating with third-party systems.
This new feature is similar in its functionality to the “watchers” but is easier to use and is better integrated in the Kibana UI. The Kibana rules you can define, with pre-set types and templates, allow you to hide some of the complexity of the low-level watcher conditions that were hard to work with.
If you are looking for more detailed information, please check out the Elastic documentation for this feature on the Elastic website.
We will go through an example below on how to setup alerts to send an email if one of your callbridges goes into “offline” status in VQCM.
We have also created a demo video which goes through basic setup and a different example scenario.
Elastic Enterprise License (ECK)
This feature requires an Elastic Enterprise License to be active, please see the Upload ECK License documentation available on our customer portal for instructions to apply yours.
Please note there is also a free 30-day trial license to test with if needed, described in the Trial ECK License documentation.
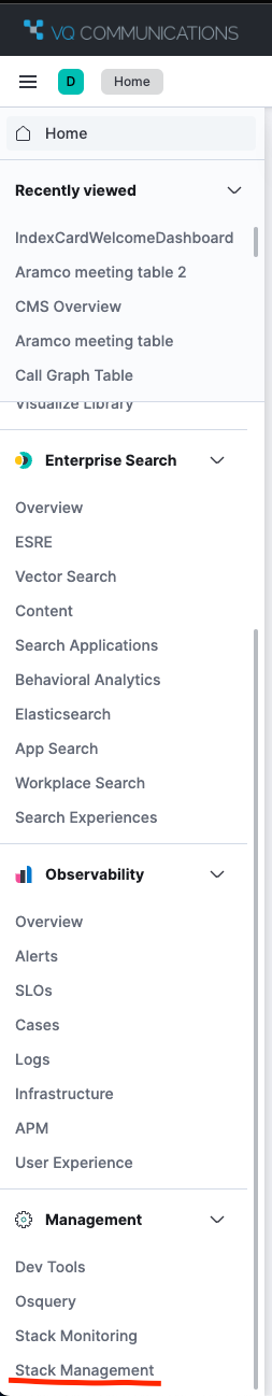
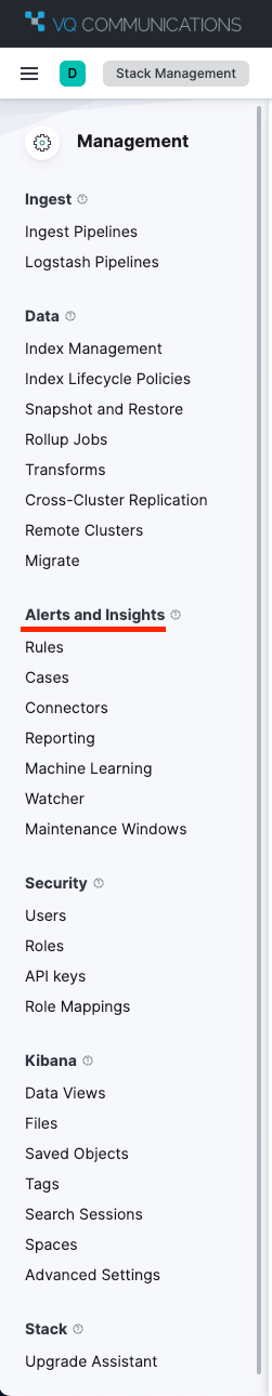
The Alerting feature is accessible in the left-hand menu under Management > Stack Management > Alerts and Insights (see screenshot below):
|
|
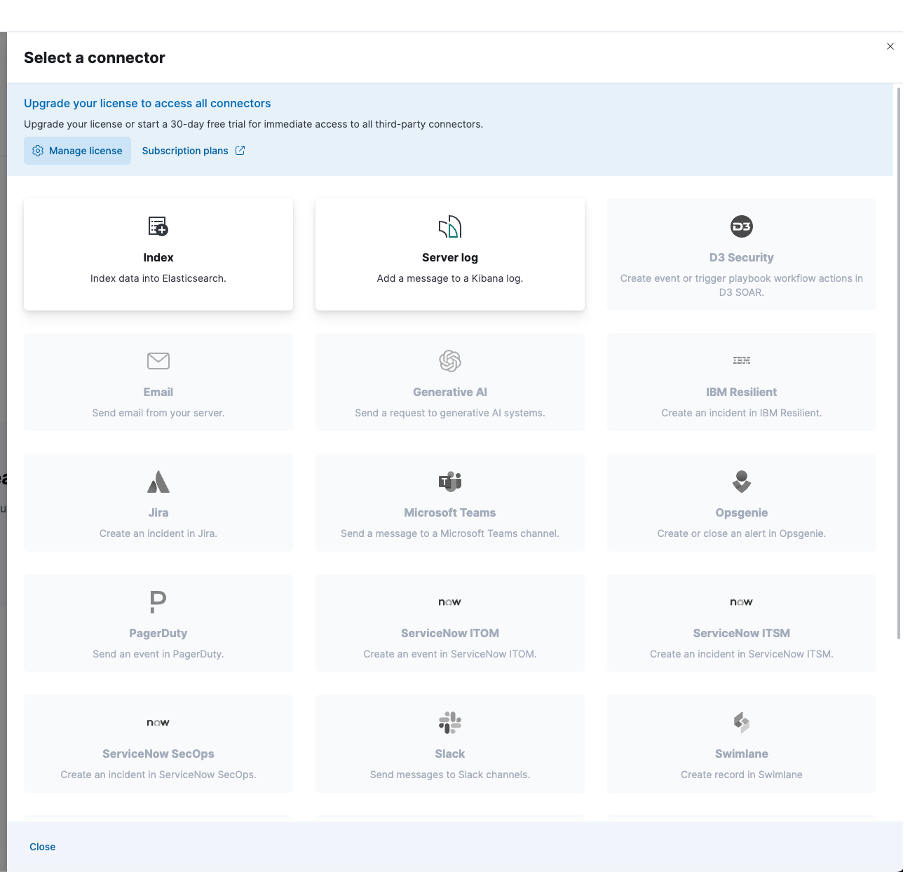
If you don’t have a valid Enterprise or Trial license applied, some options will be greyed out and stop you from using this feature fully. See the example of the connector page when the basic license is active:
Connectors
The first step is to define connectors to integrate with third-party systems to send notifications, when the desired conditions are met.
There is a variety of connector types available, which are defined in detail in the Kibana documentation. A few examples are:
-
Email
-
Jira
-
ServiceNow
-
Microsoft Teams
-
Slack
-
Webhook
For our example, we will configure an “Email” connector by going to Management > Stack Management > Alerts and Insights > Connectors > Create connector:
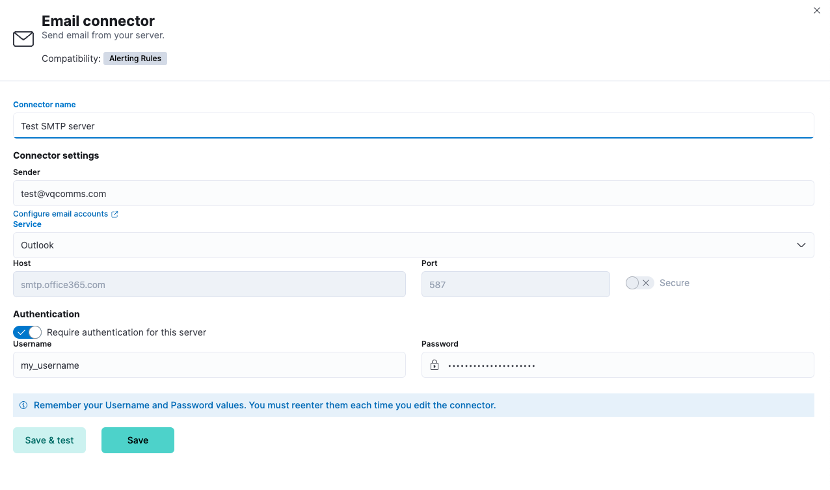
Here you will need to enter your SMTP server details, which will depend on your environment. You may also need to allow additional rules in some cases (firewall, allowed sender etc) depending on your setup.
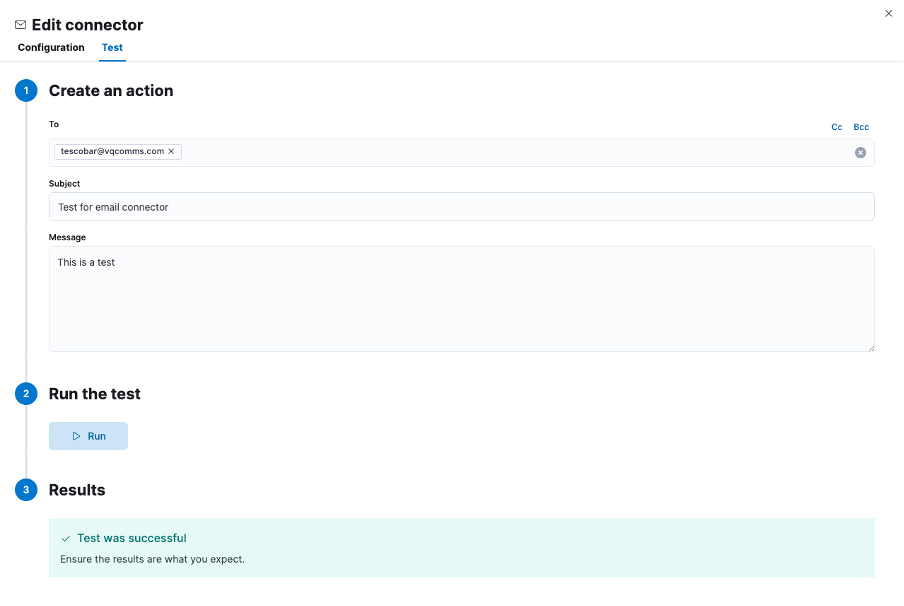
To validate your settings, you can use the “Save & test” option, which will let you choose a user to send a test email to:
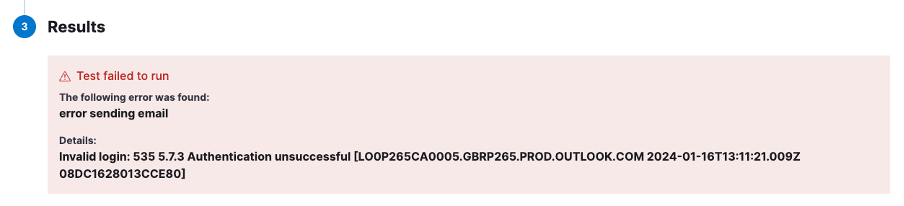
If you have misconfigured something, the test will fail, and the error will hopefully help you troubleshoot the issue (wrong credentials in the example below):
Rules
The rules define what actions will be triggered to generate notifications when the conditions you chose are met. There are multiple pre-built types of rules to choose from, see the Kibana documentation for more details.
In short, a rule is composed of the following:
-
Input
-
Schedule
-
Conditions
-
Actions
In our example we will use the “Index Threshold” rule type to monitor if a value changes past a threshold and send an email if that is the case. It will monitor the number of online callbridges reported by VQCM and trigger the notification if that number goes under the expected value:
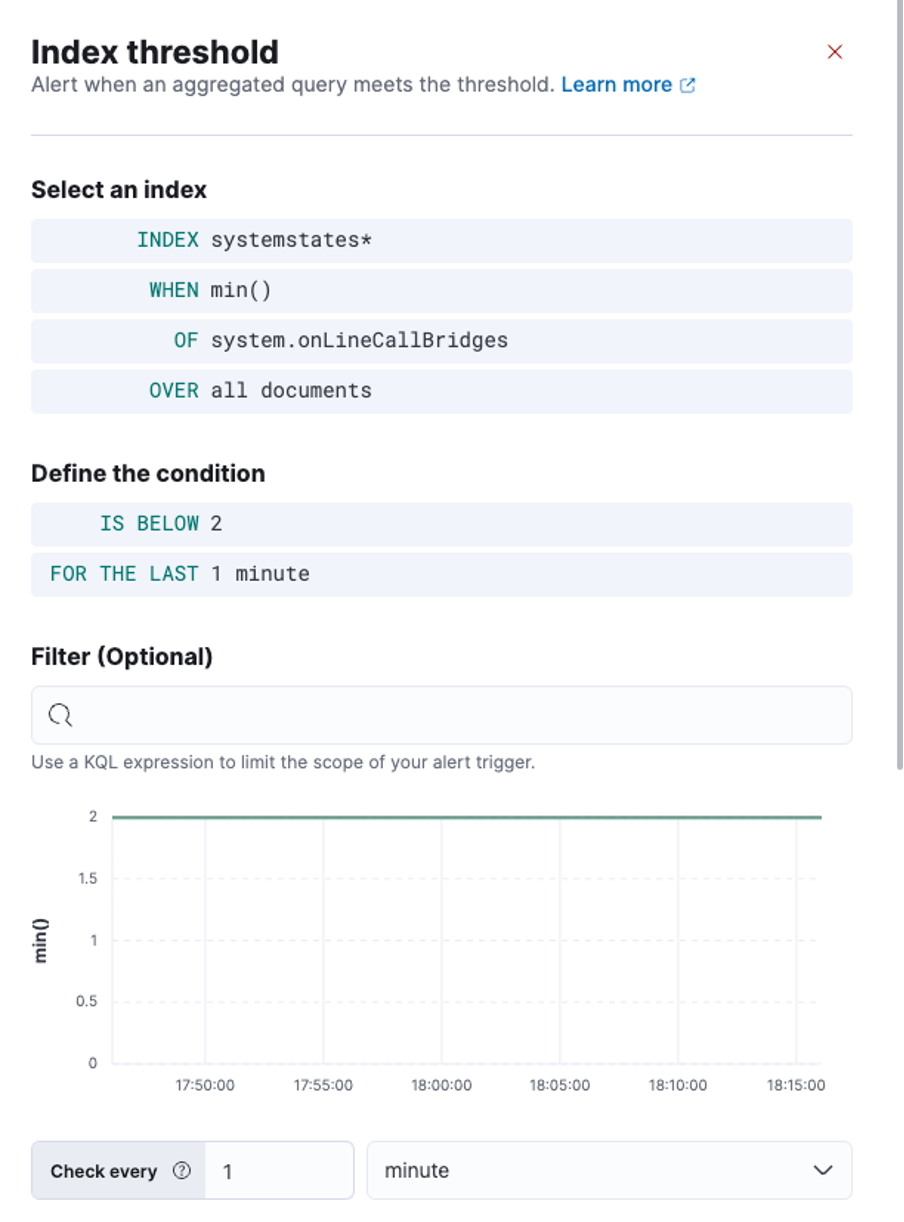
Our condition checks to see if the minimum number of callbriges goes under 2, which is how many callbridges are normally online in the example. This check is done every minute, and we check if the value is under the threshold for the last minute.
If so, we then trigger an action using the connector previously created:
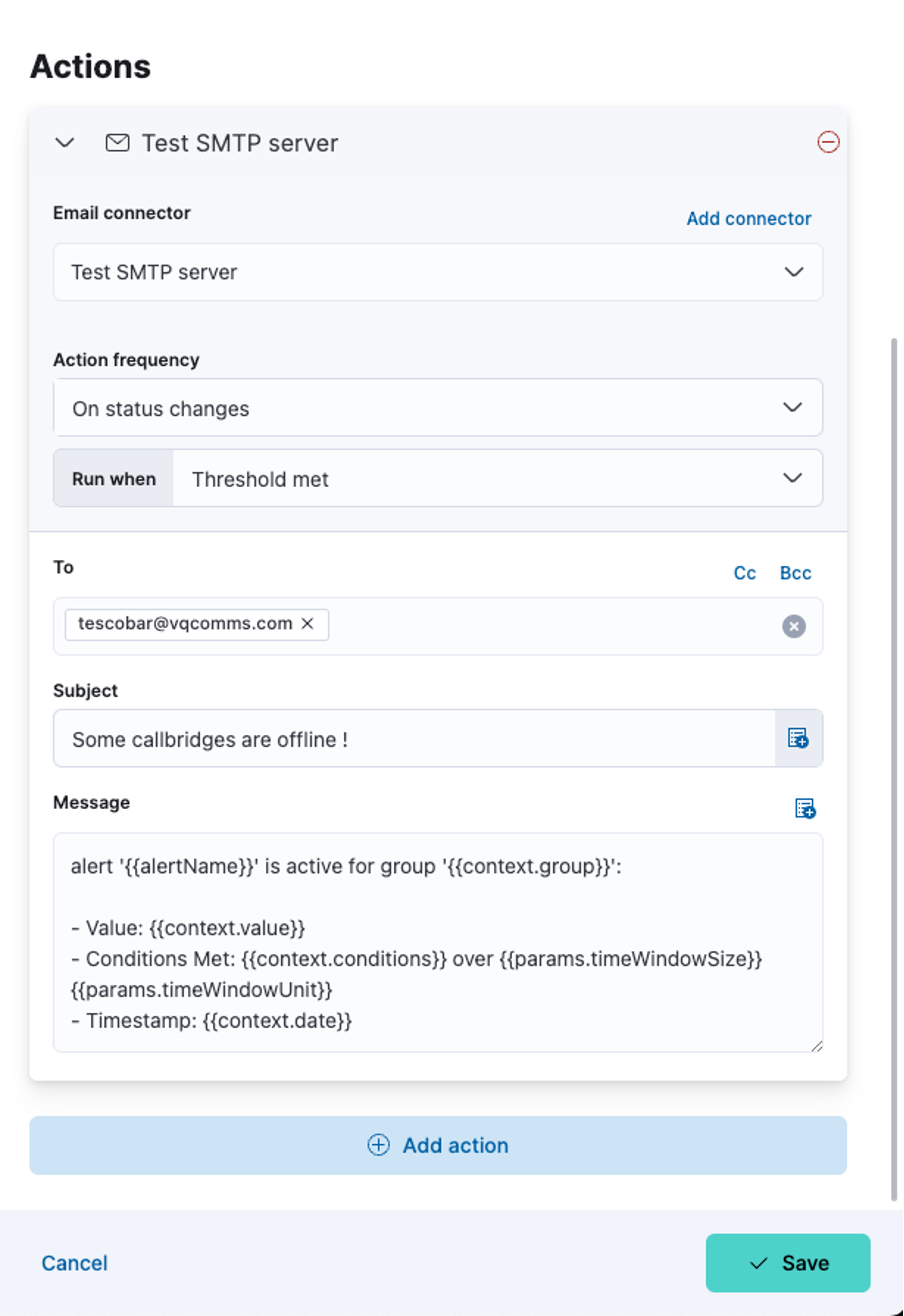
The above is the default template for the message: it shows that you can include values representative of your data at the moment the notification was sent. For example, in this case, it would show you how many callbridges are online. You can update that message as required depending on the use case and include more data if necessary.
The “Elasticsearch Query” rule type even lets you add specific fields from documents in your indices, like for example the message linked to a specific event (see example below).
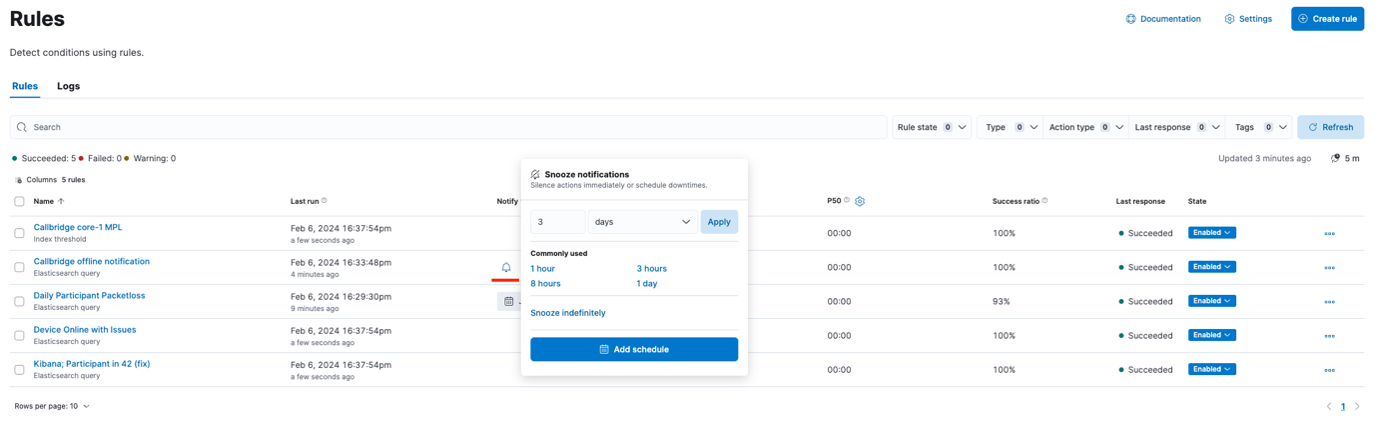
There are several options to customise the behaviour further, we invite you to browse and test them yourself. They include things like snoozing notifications, including on a given schedule:
Including document values
If you use a rule of type “Elasticsearch Query”, you can include results from the query in the output.
Here is an example of a rule based on the “McuStateChange” events raised by VQ, which will output the timestamp and message for each event captured:
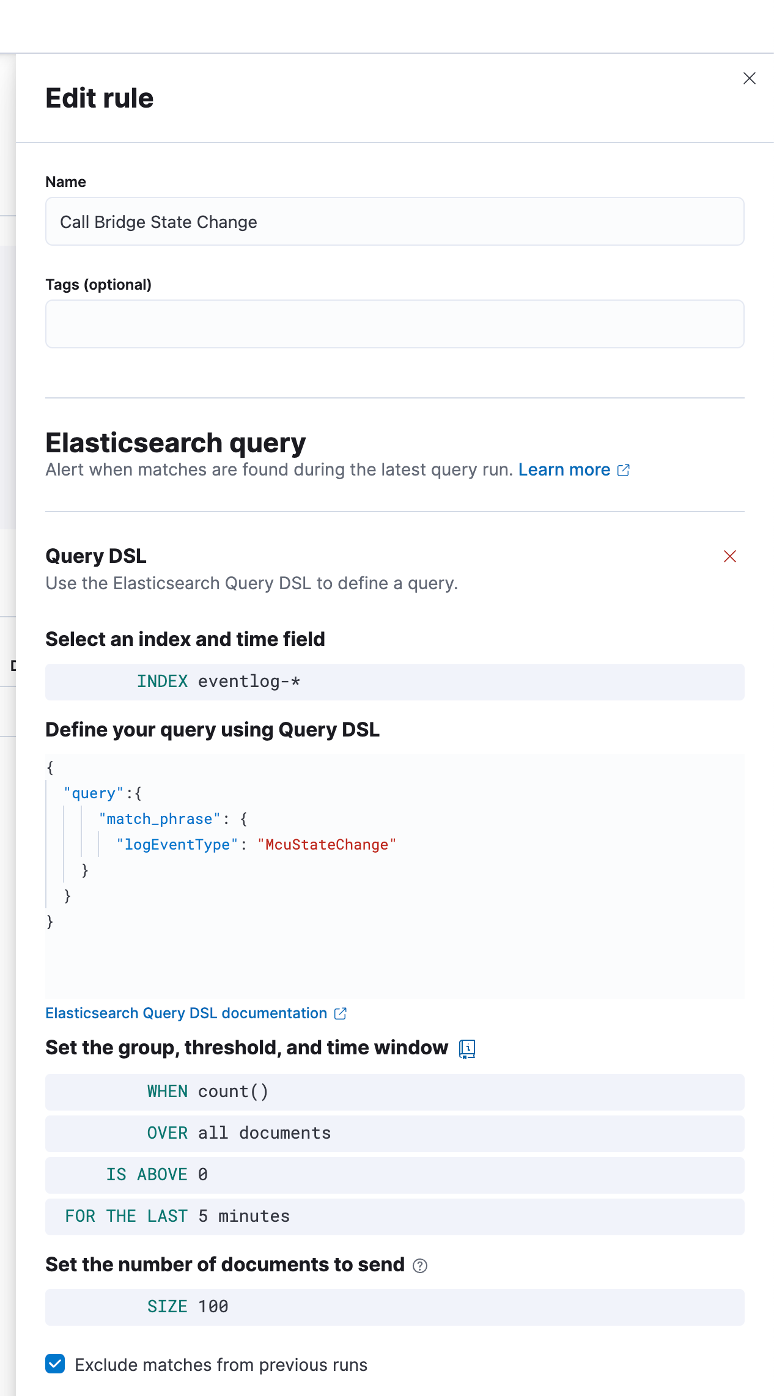
This will iterate over each document (one per “McuStateChange” event in this case) that matches the query and pull specific fields, like timestamp and message.
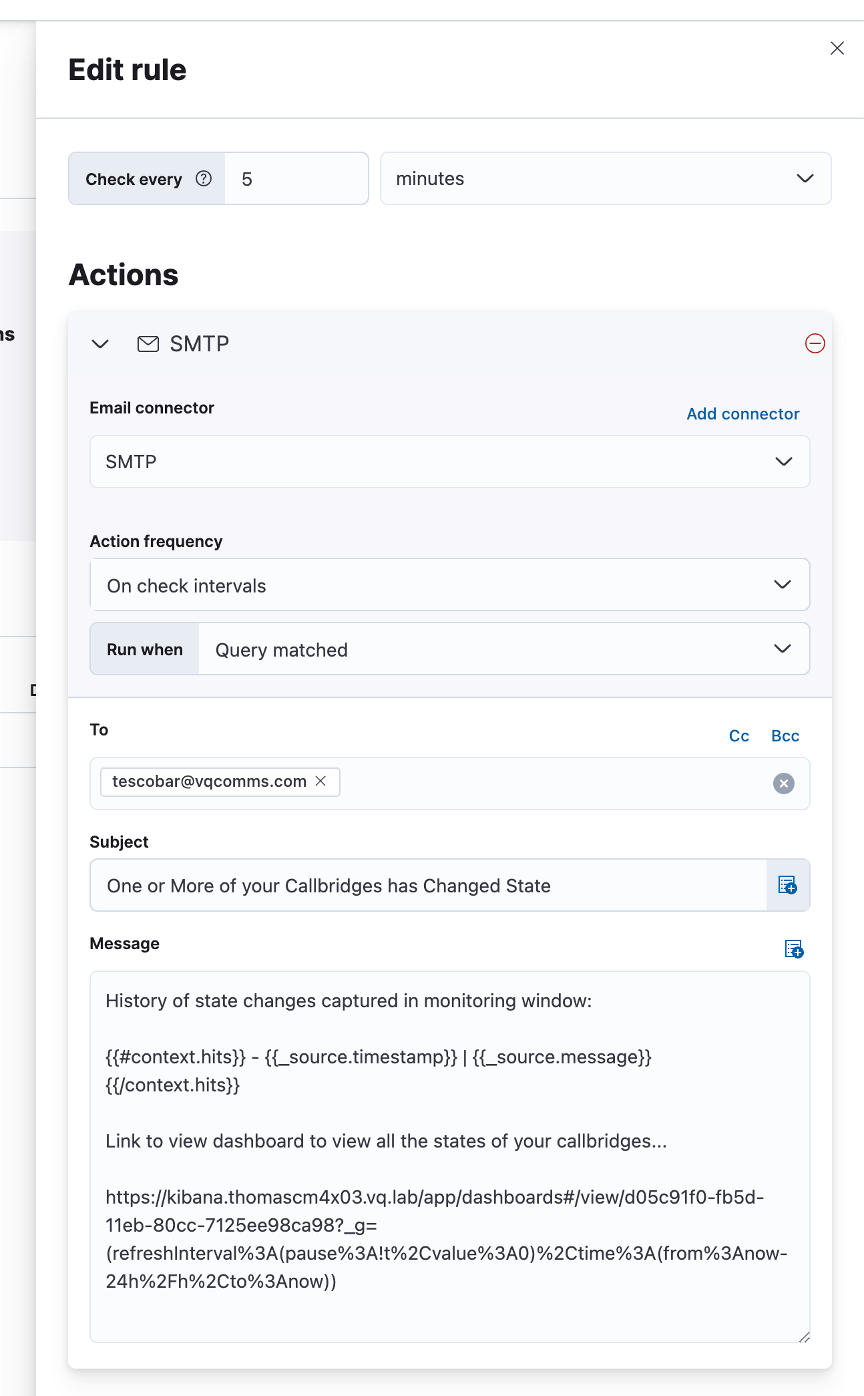
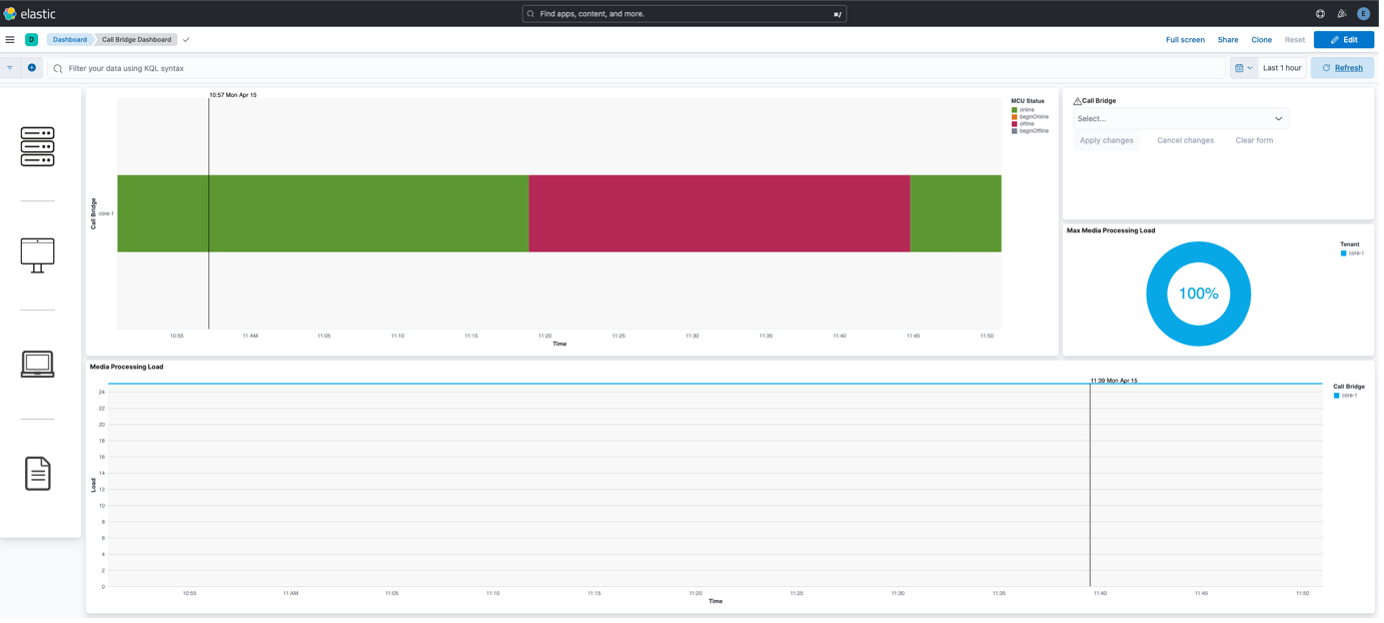
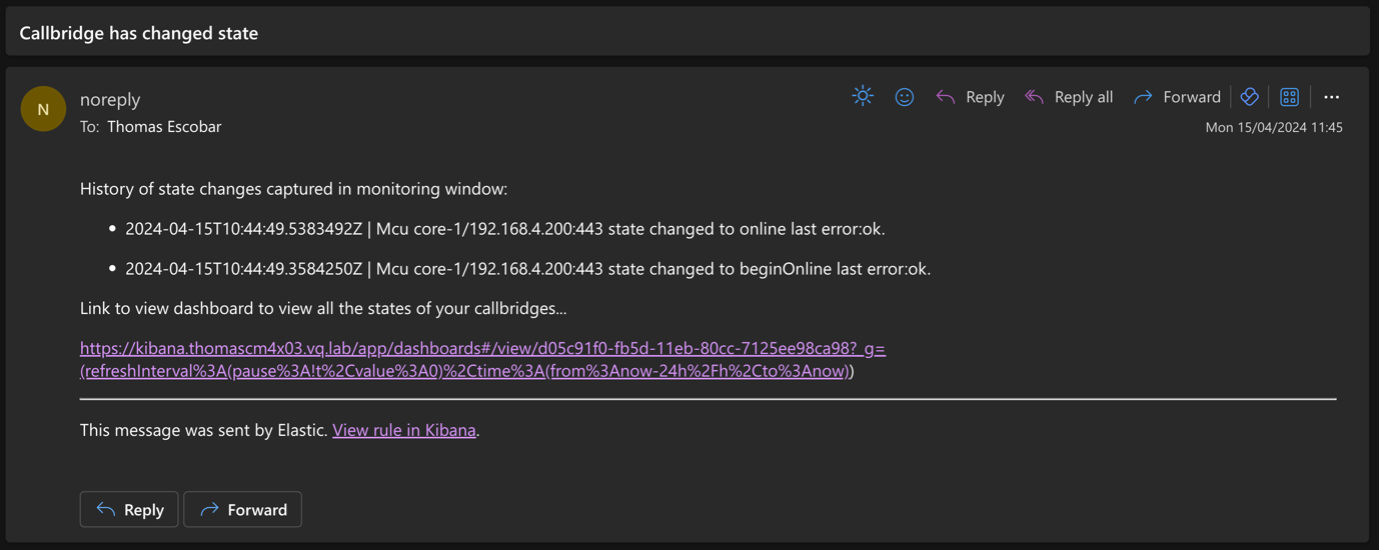
This rule also shows you can include a relevant dashboard link (“Call Bridge Dashboard” in this case, URL copied from the dashboard page) in the message template:
Example email received from the action linked to this rule:
Troubleshooting
Within the web page, you can also see the history of the previous executions of the rules and find more information about failures. See the Kibana documentation for more details on how to start troubleshooting those issues.
If the above doesn’t help you to resolve the issue by yourself, you can email us at support@vqcomms.com.