Setting up CMS and Expressway external monitoring with Elasticsearch
Introduction
VQ Conference Manager includes the capability to integrate data into Elasticsearch and Kibana from external sources, such as Expressway.
This functionality will undergo changes in the future, aiming at a complete feature release in a future version. This will include a visual interface to configure the deployment of the monitoring in the VQCM Admin page.
We DO NOT recommend running this functionality on production systems at the moment, as it is still unstable and can cause negative impact on the VQ system. This feature is being heavily tested and will be refined and optimised, and we will start recommending running it on production systems once we are 100% confident in its stability.
Any feedback and suggestions will be appreciated and will allow us to improve the user experience. Please send these to support@vqcomms.com.
We will now explain the process to start collect Call Data Records (CDRs), Logs and Metrics from Expressway, as well as Logs from CMS.
Setup Expressway (CDRs, syslog, collectd)
Expressway clusters are supported (from 3.7.x). All the Expressway nodes in a cluster share the same System Metrics collection server details (address and port), as this is a cluster wide setting.
However, each node needs to specify it’s own Remote Syslog Server details, as this is a per-node setting.
You will have to do this step for each Expressway node you have, and assign them each a different port for Logs. You will only have to assign one port per cluster for the Metrics, and this configuration should be done on the primary node. The Metrics configuration from the primary node should then be shared to the other nodes in the cluster.
NOTE: If your Expressway nodes are not clustered, then simply consider they are each in a cluster on their own.
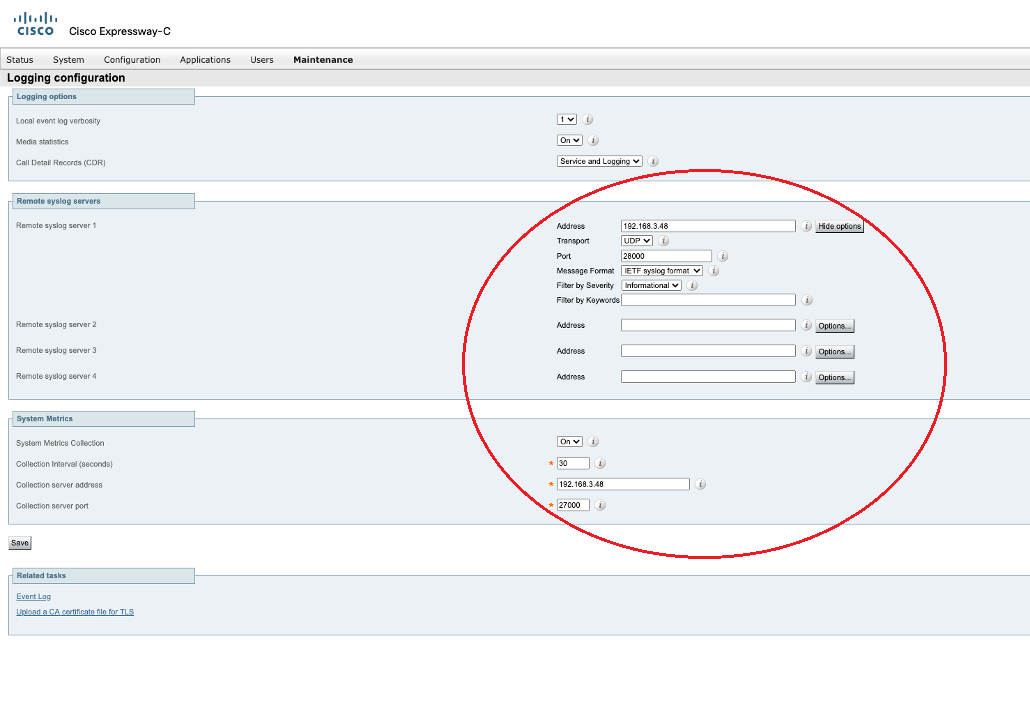
Go to the Expressway web page, and login as an Administrator. Click on Maintenance -> Logging.
From here, you can now enable the Media Statistics, as well as the CDRs to be sent via syslog.
You can add a remote syslog server, targeting your VQCM VM:
- Address: IP of your CM VM
- Transport: UDP
- Port: Port chosen for the syslogs of this node of Expressway, we suggest 28000 for node 0, 28001 for node 1…
- Message Format: IETF syslog format
- Filter by Severity: Informational
You can also enable the System Metrics (collectd):
- System Metrics Collection: On
- Collection Interval (seconds): Interval chosen, default is 60s Collection server address: IP of your CM VM
- Collection server port: Port chosen for the metrics of this Expressway cluster, we suggest 27000 for cluster 0, 27001 for cluster 1...
Once you have a page similar to the following screenshot, click Save.
Setup CMS (syslogs)
You will have to do this step for each CMS node you have, and assign them each a different port.
SSH onto your CMS node by running the following command from a terminal:
ssh <user>@<CMS_FQDN_OR_IP>
From there, you can now run MMP commands, documented in this document: https://www.cisco.com/c/dam/en/us/td/docs/conferencing/ciscoMeetingServer/Reference_Guides/Version-3-0/Cisco-Meeting-Server-MMP-Command-Reference-3-0.pdf
The ones that will be useful here are:
syslog
- Lists the current syslog configuration
syslog enable
- Enables the syslog mechanism
syslog server add <hostname> [<port>]
- Adds a syslog server
syslog server del <hostname>
- Removes a syslog server
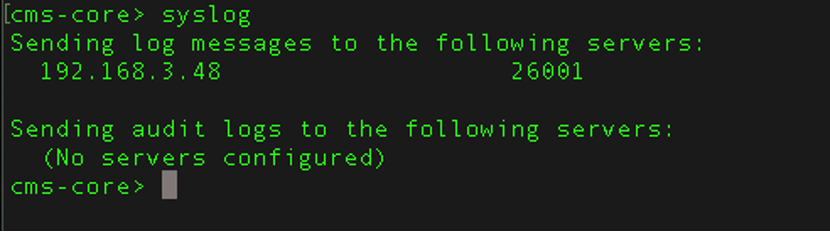
We recommend adding the syslog server, then checking that the changes have been applied properly by running the commands:
syslog server add <CM_FQDN_OR_IP> <CMS_NODE_PORT>
syslog
with:
CMS_NODE_PORT: Port chosen for the syslogs of this node of CMS, we suggest 26000 for node 0, 26001 for node 1…
The output should look like the following screenshot:
Firewall Rules
- If you have a firewall running between the CM VM and the different sources of data, you will need to set a certain number of rules to allow the data ingestion:
- For each of the CMS nodes sending logs to VQCM, open the port specified in CMS with the TCP protocol
-
For each of the Expressway nodes sending metrics/collectd data, open the port specified in Expressway with the UDP protocol. This will be the same port for all nodes in the same cluster
- For each of the Expressway nodes sending logs to VQCM, open the port specified in Expressway with the UDP protocol
NOTE: Ideally, as CMS and Expressway are both sending syslogs, we wanted to use the same protocol for both (TCP). We have tried using TCP for Expressway syslogs, but had issues with the format of logs sent. Therefore, we are only supporting the UDP protocol for Expressway syslogs at the moment.
Setup CM
Currently, you will have to run the commands manually from the CM VM. Once this feature is fully released in a future version of VQCM, a visual interface should be available in the VQCM Admin web page to configure this.
You can either run those commands from the Emergency Shell of the VM (skip the SSH and root privileges steps if you do so), or SSH into the VM from a terminal.
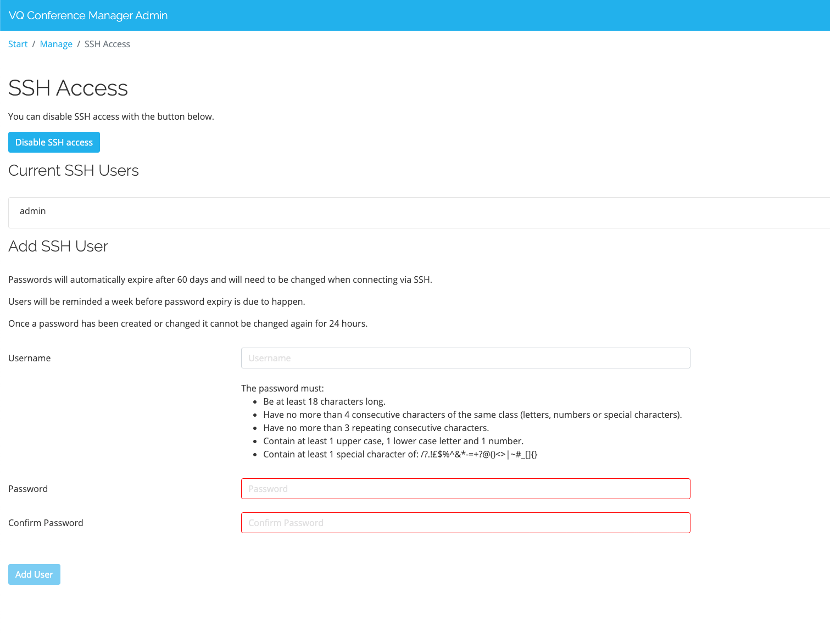
You will have to enable SSH access from CM Admin, and create a SSH user, see following screenshot:
You can then SSH into the CM VM by running the following command:
ssh <user>@<CM_FQDN_OR_IP>
We then need to get root privileges, by running the following command. You will need the root password:
sudo -i
You now need to move to the correct directory:
cd /vq/ansible/playbooks/ext-monitoring/
You will have to edit a config file and fill in details about each CMS or Expressway node you want to monitor. This file to modify is empty by default, but an example is provided with the right syntax and indentation to follow in the same folder.
NOTE: This file will be preserved even after updating the system.
The config file to edit and fill in can be found at:
/vq/ansible/playbooks/ext-monitoring/roles/deploy-k8s-object- s/vars/main.yaml
The example config file can be found at:
/vq/ansible/playbooks/ext-monitoring/roles/deploy-k8s-object- s/vars/main-example.yaml
If this is the first time you edit this config file, we recommend you copy the example file over the empty file, and then modify that. You can do so by running:
cp /vq/ansible/playbooks/ext-monitoring/roles/deploy-k8s-objects/vars/main-example.yaml /vq/ansible/playbooks/ext-monitoring/roles/deploy-k8s-objects/vars/main.yaml
You can edit the config file by running:
nano roles/deploy-k8s-objects/vars/main.yaml
For how to use nano, see https://www.nano-editor.org/dist/latest/cheatsheet.html
Alternatively, if you do not want to use terminal based editors, you can copy the file via scp/rsync off the VM, edit it there, and then push it back.
NOTE: This is a yaml file, and you should make sure to keep the structure / indentation as found in the template file, as it is an important part of the yaml format. Make sure to use spaces to do indentations, and not tabulations. The following website should help you to fix any formatting problems:
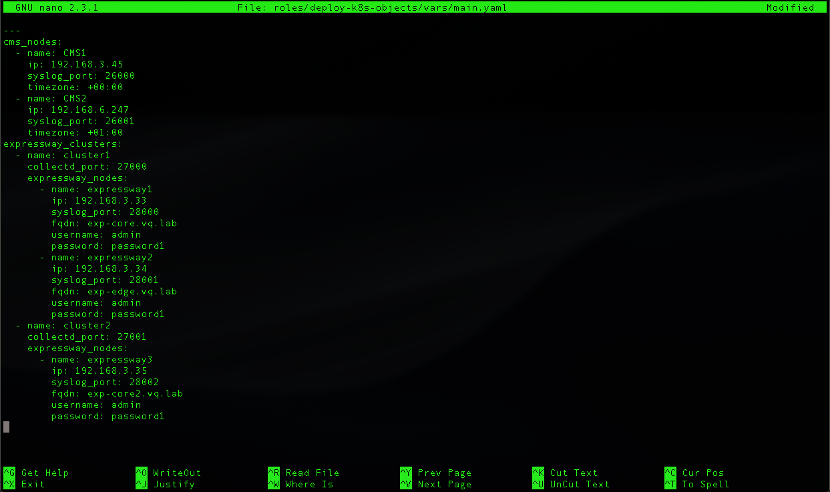
For each Expressway cluster configured previously, you will have to add an object under expressway_clusters with the following parameters (if you have a single Expressway node, or multiple nodes that aren’t clustered, you still need to fill in details of a “made up” cluster that will only contain that one node):
- Name: Name of the Expressway cluster (needs to be lower case)
- Collectd_Port: Port configured previously on the Expressway page for “Collection server port” (we recommend 27000 for the first cluster, 27001 for the second...)
- Expressway_Nodes: List of Expressway nodes in the cluster. For each Expressway node configured previously, you will have to add an object under expressway_nodes with the following parameters:
Name: Name of the Expressway node (needs to be lower case) IP: IP of the Expressway node (cannot be an FQDN)
Syslog_Port: Port configured previously on the Expressway page for “Remote syslog server 1: port” (we recommend 28000 for the first node, 28001 for the second...)
FQDN: FQDN of the Expressway node
Username: Username of the Expressway admin account. (This account technically only needs access to the API, and could be a read-only user. This is NOT the same user as VQCM)
Password: Password of the Expressway admin account
For each CMS node configured previously, you will have to add an object under cms_nodes with the following parameters:
- Name: Name of the CMS node (needs to be lower case)
- IP: IP of the CMS node (cannot be an FQDN)
- Syslog_Port: Port configured previously via the CMS MMP command (we recommend 26000 for the first node, 26001 for the second…)
- Timezone: The timezone offset used by your CMS node, compared to UTC time. The format used is: +01:00 for UTC+1. This can be found by using the “timezone” MMP command, which will give you the name of the timezone used
This is an example of the final file after editing, with 2 Expressway nodes in one cluster, 1 Expressway node in it’s own “made up” cluster and 2 CMS nodes:
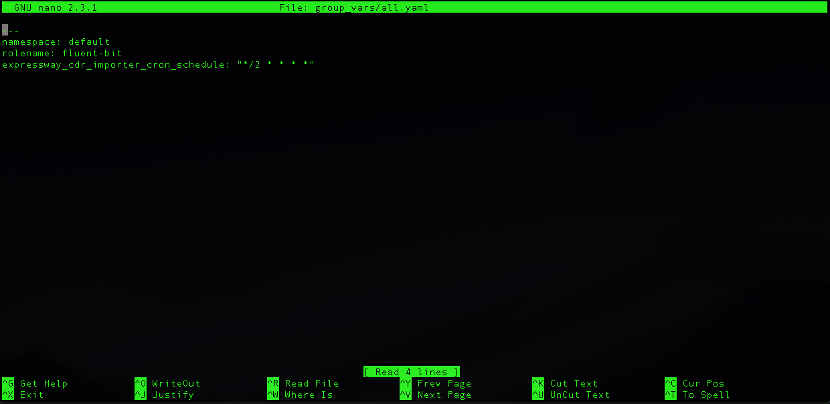
Finally, you can change the schedule used to pull CDRs from the Expressway nodes. The default schedule is every 2 minutes.
This can be done by editing the parameter “expressway_cdr_importer_cron_schedule” in in the file:
/vq/ansible/playbooks/ext-monitoring/group_vars/all.yaml
by running:
nano group_vars/all.yaml
We are using standard cron expressions. This website can help you with understanding/editing the schedule:
The default file looks like this:
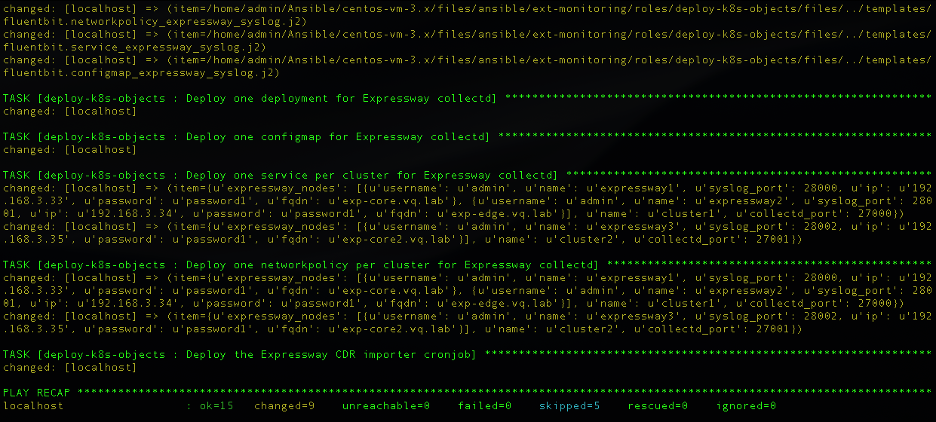
Once all of this has been configured, you are ready to deploy the monitoring components. From the same location, run the following command to deploy the components:
ansible-playbook playbook.yml --tags="create"
If you want to teardown the components, you can do so by running the following command:
ansible-playbook playbook.yml --tags="delete"
The output should look similar to the following screenshot (there shouldn’t be any errors):
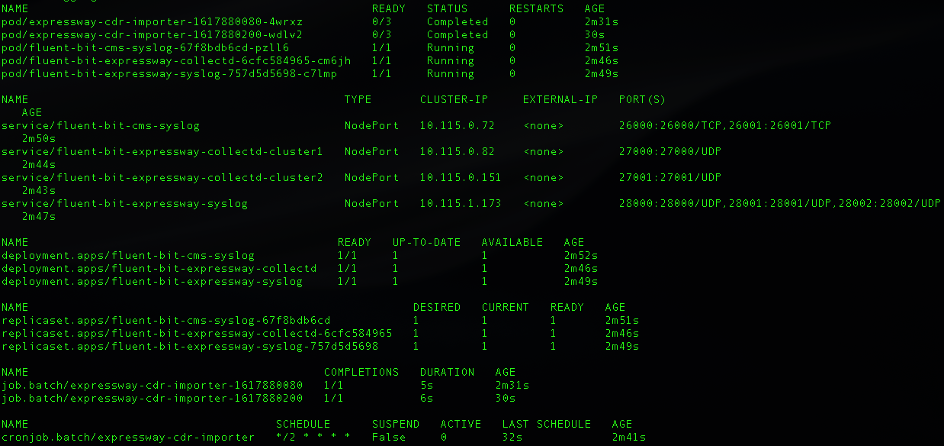
You can run the following command to check the state of all the components related to external monitoring:
kubectl get all -l app.kubernetes.io/component=external-logging
The output should look like this:
Once this is complete, data should start coming into Elastic, and you should be able to see it in Kibana on the related dashboards:
- Expressway Metrics – Metrics coming in from Expressway (metric collection, collectd)
- Expressway Participants – Data coming in from Expressway CDRs regarding the calls and participants
- Expressway Logs – List of logs coming in from Expressway (syslogs)
- CMS Logs – List of logs coming in from CMS
Restart monitoring after an upgrade
When you upgrade VQCM to a newer version, the external monitoring will NOT be restarted automatically, and needs to be re-enabled manually. This is by design, as things might change from one version to another and require manual modifications.
The config that was used in the previous version will be copied and saved in a different location, but the config file used by the playbook will be reset to blank. You will have to either re-use the saved config, or re-write a new one following the documentation in section 1.5.
If you want to see which config was saved, you can find the file at the following location:
/persist/config/ext-mon.yaml
You can display the content of that file by running the following command:
cat /persist/config/ext-mon.yaml
If the content of that configuration file looks valid to you and conforms to the format defined in section 1.5, you may go ahead and use that file again to restart the monitoring.
If it looks different from section 1.5, please make sure you read that paragraph and update the config file to match the new format.
NOTE: The format changed from VQCM 3.6 to VQCM 3.7, but not from VQCM 3.7 to VQCM 3.8.
You can copy that file back in its place by running the following command:
cp /persist/config/ext-mon.yaml /vq/ansible/playbooks/ext-monitoring/roles/deploy-k8s-objects/vars/main.yaml
Once that is done, you can run the commands described in part 1.5 to run the playbook and create the monitoring components.