Legacy Analytics/Kibana Dashboards
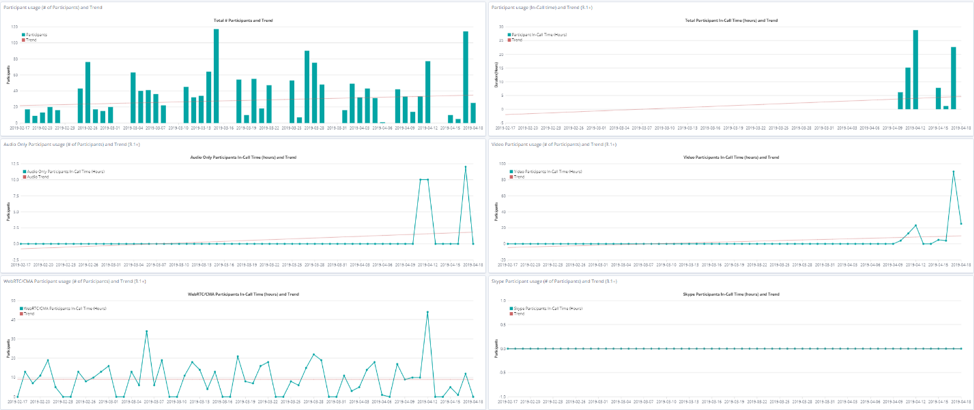
The pre VQCM 3.9 Dashboard looks like this (truncated screenshot):
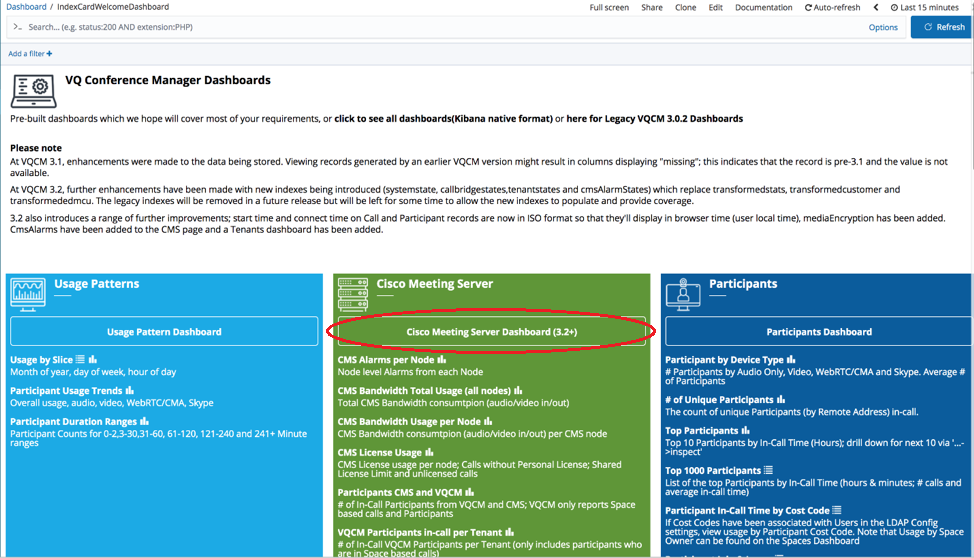
There are 7 groupings:
|
Tile |
Description |
|---|---|
|
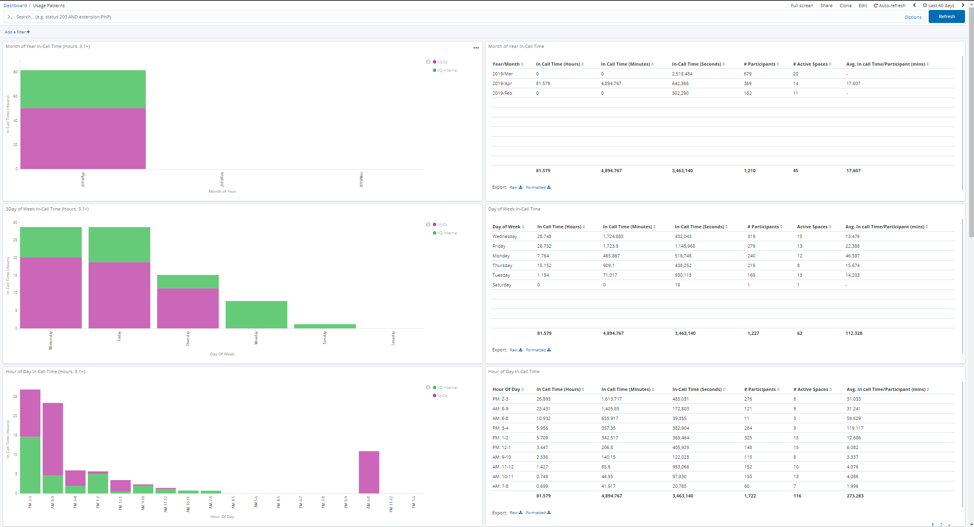
Usage Patterns
|
View usage over time; includes monthly, day of week, hour of day and by device type (Video, Audio Only, WebRTC/CMA and Skype) |
|
Operations
|
View which Participants were in calls/Spaces and a variant that provides visibility on Participant Alarms and call quality. |
|
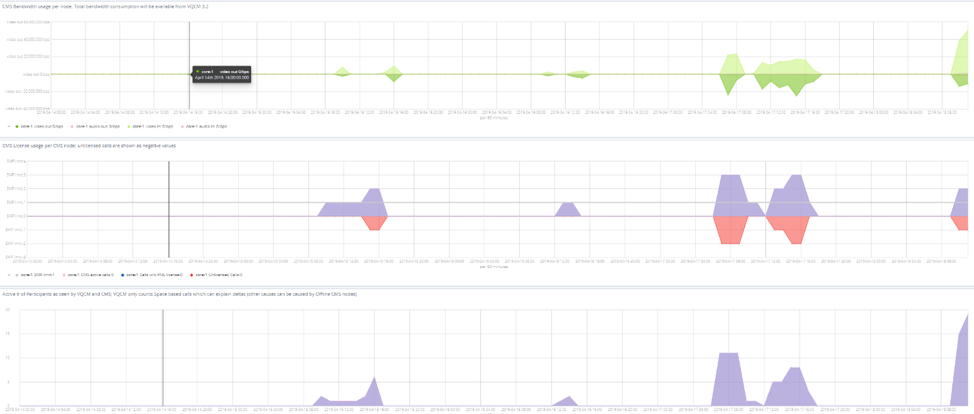
Cisco Meeting Server
|
View CMS bandwidth consumption per node; CMS license consumption and CMS media processing load. |
|
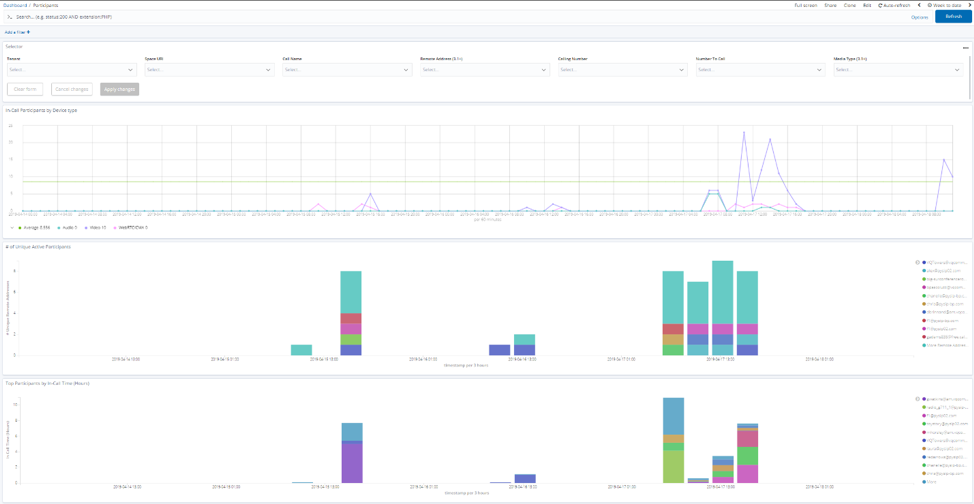
Participants
|
View Participant data such as number of Active Participants, Top Participants, Participants by Cost Code and Disconnect Reasons |
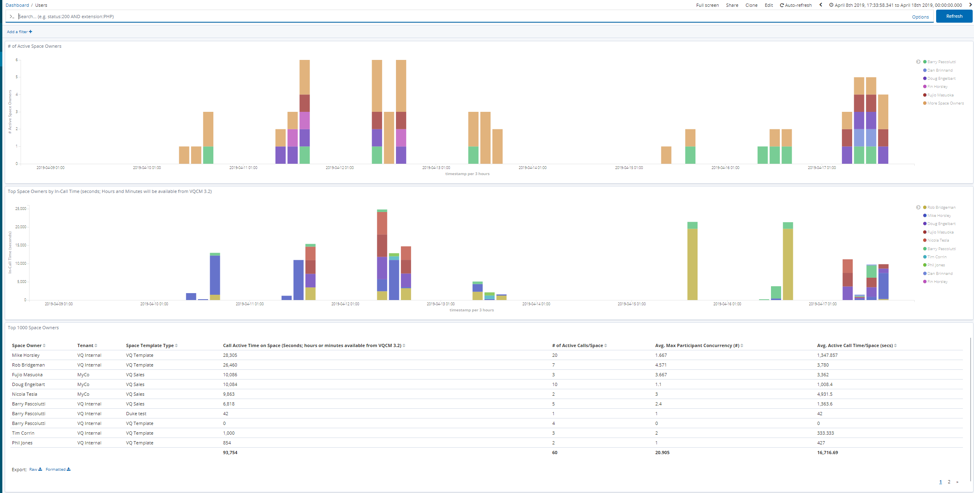
| Users |
View number of Active Users, the Top Users (by in call time on their Spaces) and by Cost Code |
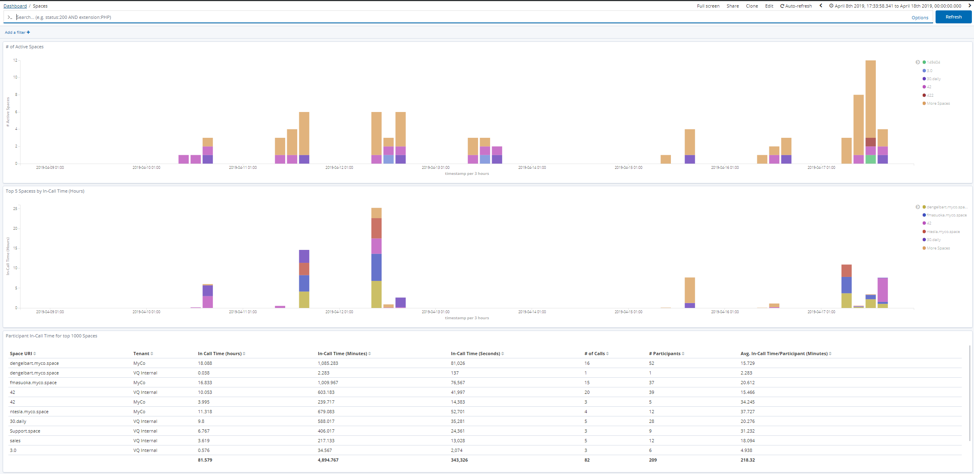
| Spaces | View Active number of Spaces, Top Spaces by in call time |
| Internal VQCM diagnostics |
Internal data for VQ Support |
Some representative screenshots
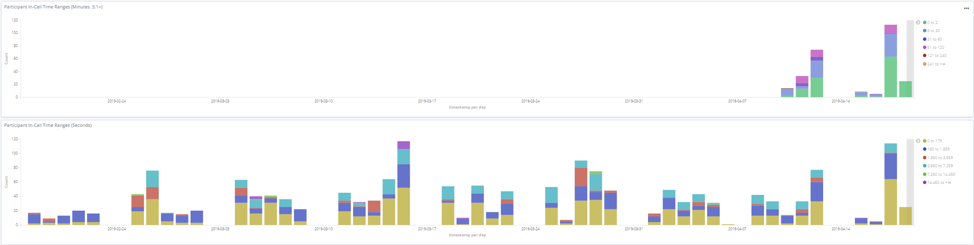
Usage Patterns
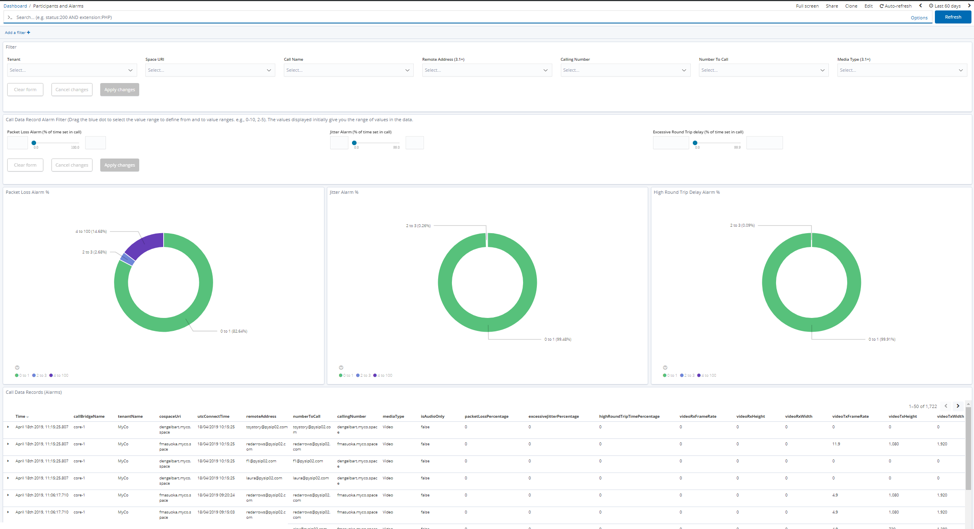
Operations
Participants and Alarms:
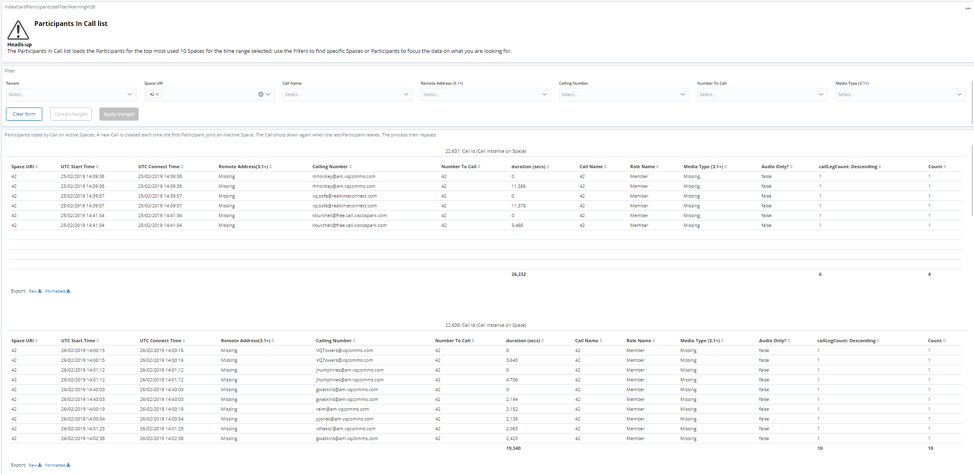
Find Participant in Call Bridge
In this example, note how Space 42 has been selected as a filter:
Cisco Meeting Server
Participants
Users
Spaces
Dashboard, Visualization and Search maintenance and update Policy
The VQCM upgrade tool will replace VQCM dashboards, visualizations and searches if updates are available.
Please, therefore, copy (clone) our dashboards, visualizations and searches if you want to make changes.
To edit dashboards, open a Dashboard, click “edit” from the menu and then “save”; on the “save”, you will have the option to “save as a new file”. Remember that Dashboards consist of one or more Visualizations. The easiest way of finding the visualizations is to edit the dashboard and then click on the cog icon against each visualization. Edit the visualization and save as a new visualization (if you need to change the visualization). Edit and save your new copy of the Dashboard before editing and renaming visualizations.
Updating Dashboards or creating your own.
Updating a Dashboard is easy; open a Dashboard and click “edit” from the menu. Then click Menu>Add and add the visualization[s] required. Drag and drop them to position and resize as required.
Please read section “Dashboard, Visualization and Search maintenance and update Policy”.
Elastic data improvements
The data VQCM writes into Elastic has had a major reworking. The indexes that contain VQCM data are the following:
- System State
- Tenant State
- CallBridge State
- CMS Alarms
- Call Analytics
- Participant Analytics
The following indexes remain but will be phased out once there is sufficient equivalent data in the replacement indexes (for example, in 12 months-time).
- Transformed stats (aka "Session Statistics")
- Replaced by System State
- Transformed Customer (Customer/Tenant usage summary)
- Replaced by Tenant State
- Transformed MCU (Call Bridge/CMS node data)
- Replaced by Call Bridge State
- Additional new Index,CMS Alarms added
Elastic data population
The core VQCM processes collect a variety of data and write it into Elastic. The data is written approximately every second. Elasticsearch is an object store and is unlike a conventional database; it trades performance for some of the features traditionally associated with a “classic” (or relational) database. There are no, for example, relationships between tables (or indexes).
The VQCM “metrics digester” process (Pod) collects the data from VQ and writes a collection of documents to the database every time slice. Each document is written with the same time stamp; the time stamp is then used to group all the data associated with the same point in time.
So, for example, if your system has 3 CMS Nodes, VQCM will write a “state” document for each CMS node on your system every time slice. Looking in the “Discover” panel of Kibana (having selected the “Call bridge States” index) , you’d see 3 documents in “Call Bridge States” at 09:00:00, another 3 at 09:00:01 and another 3 at 09:00:02.
The data in the Indexes can be processed by Searches or Visualizations; the results are displayed in Dashboards.
The following sections describe the contents of the VQCM indexes:
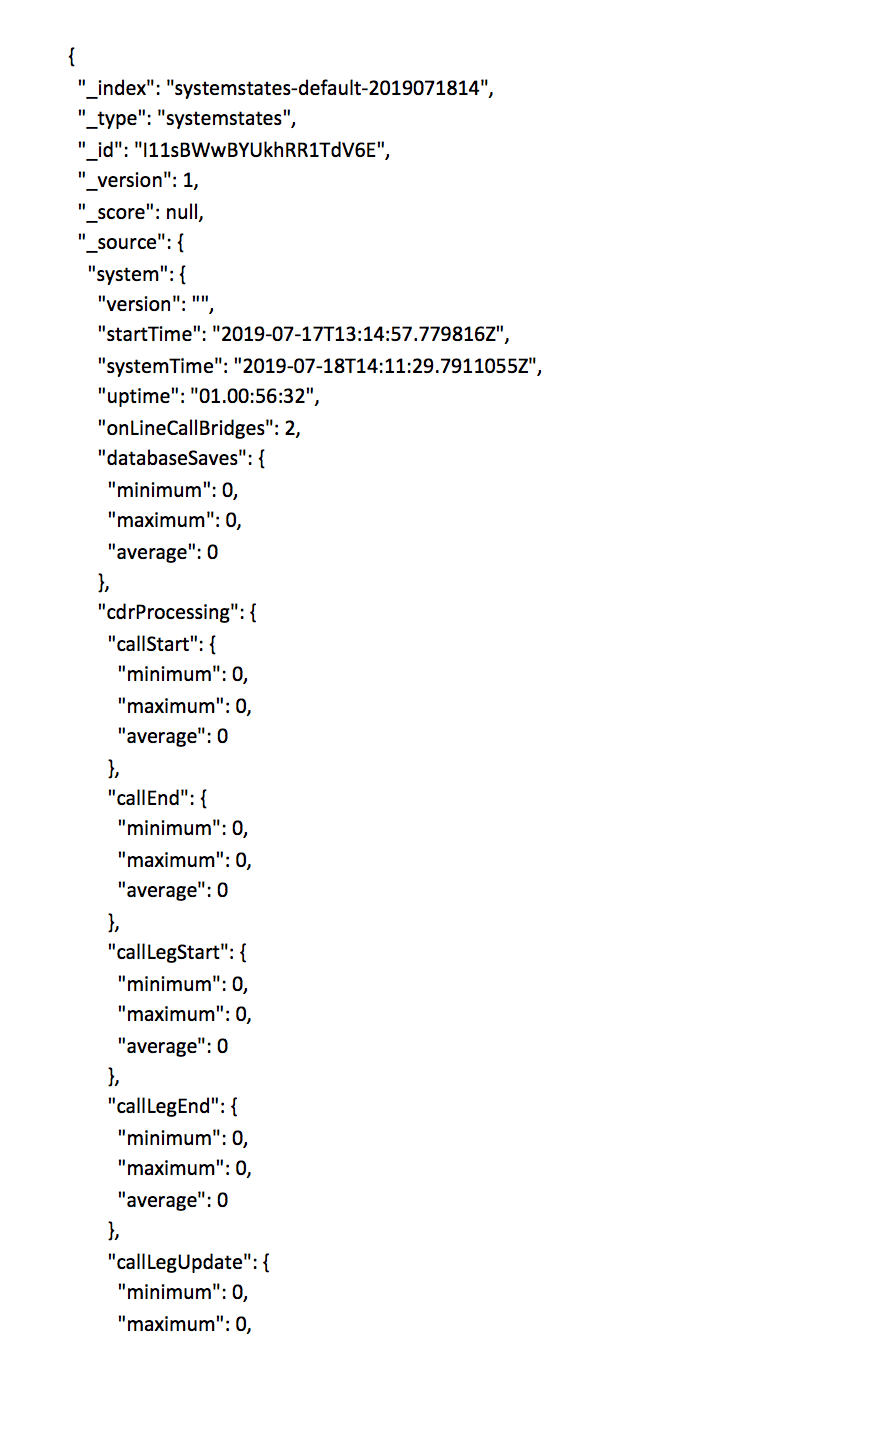
SystemState
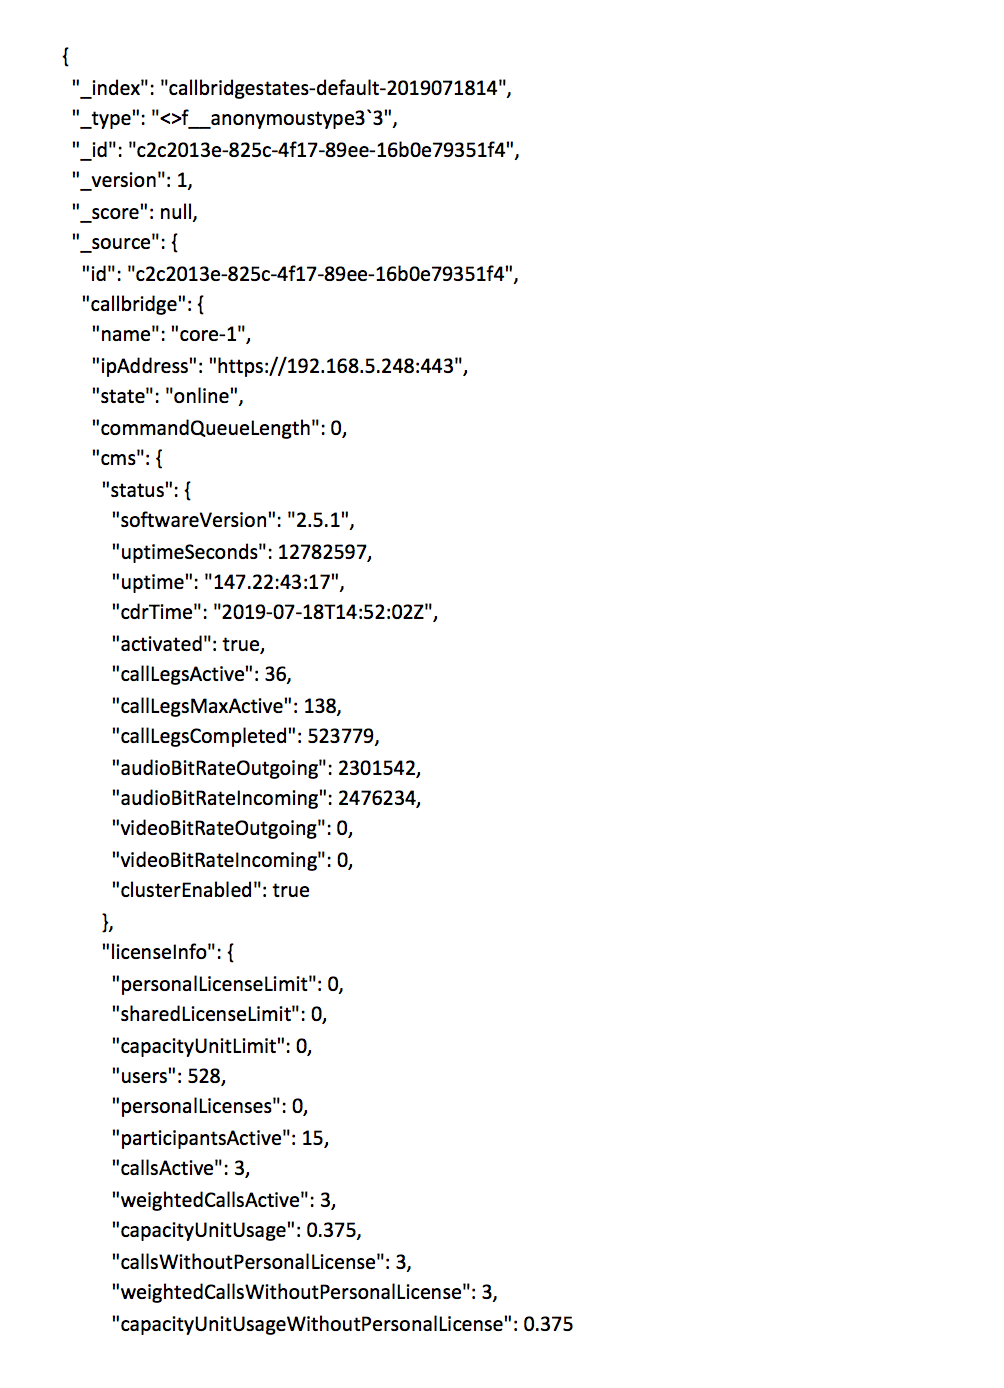
As the name suggests, this is a snapshot of the current state of VQCM. The data includes totals for key CMS data such as bandwidth consumption and licensing.
“System” contains an overview of VQ’s state; how long its been running, software version, number of call bridges, online call bridges, number of Tenants, Users and Endpoints. It also contains data on how the system is performing, how long its taking key Call Data Record (“CDR”) processing paths to execute (msecs) and how the database is performing (save times/msec).
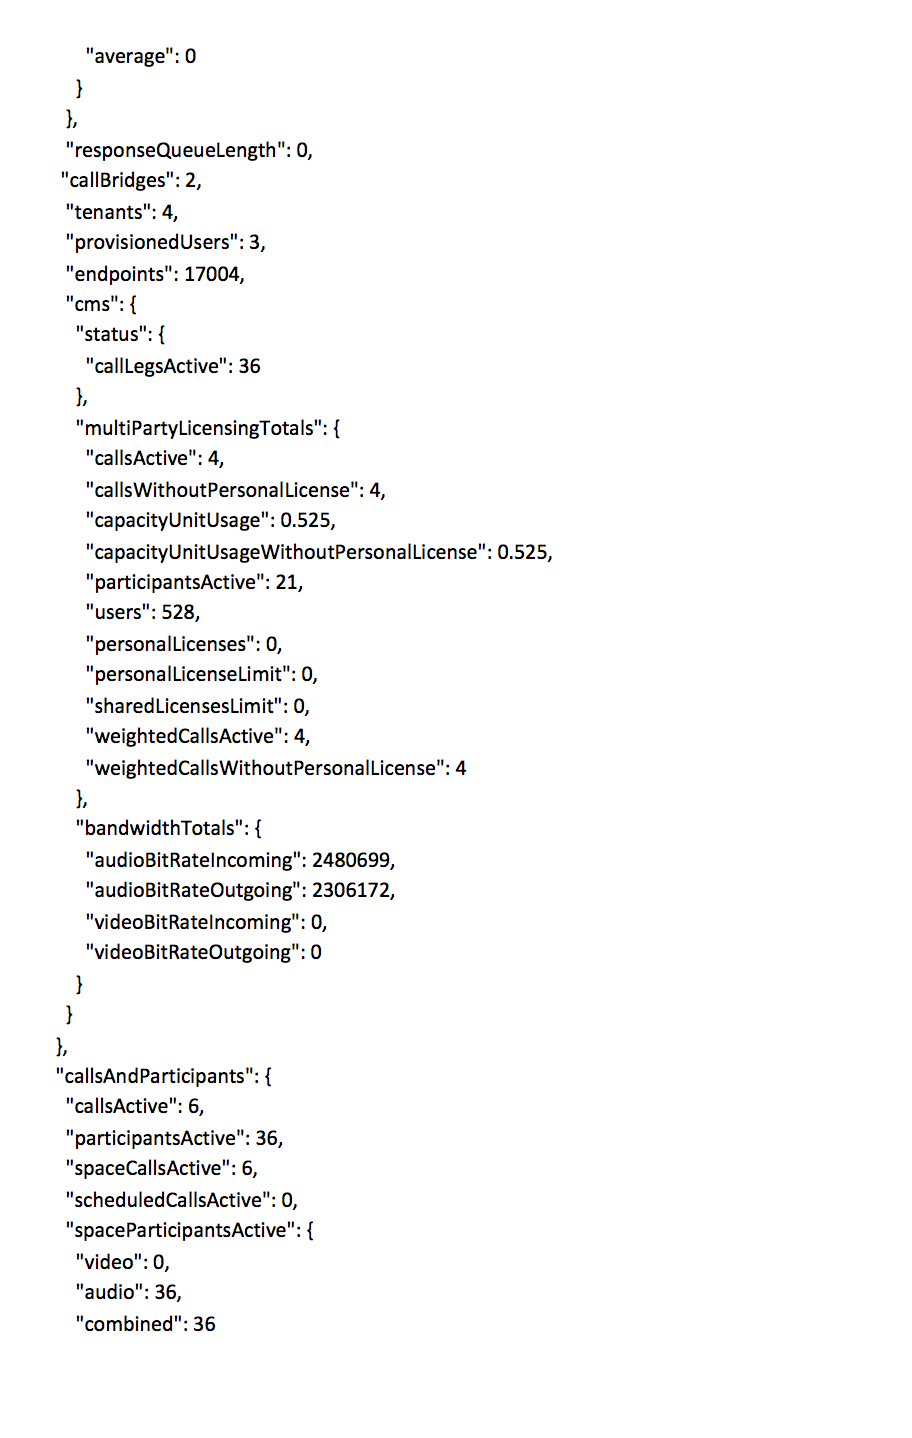
“Cms” contains summary data for the CMS nodes in the system. Status is the real-time number of how many Call Legs (Participants) are active. Multipoint Licensing is the aggregated (Sum/Total) value of the Multipoint licensing information returned from each call bridge node. Note that this licensing data differs from the status information in that it is not real time. It can be up to 5 minutes late. Also note that the licensing data collection process has changed at CMS 2.6 and we need to update VQ to support the new mechanisms; this data will therefore change in a future release. Bandwidth is the aggregated value of from all call bridges.
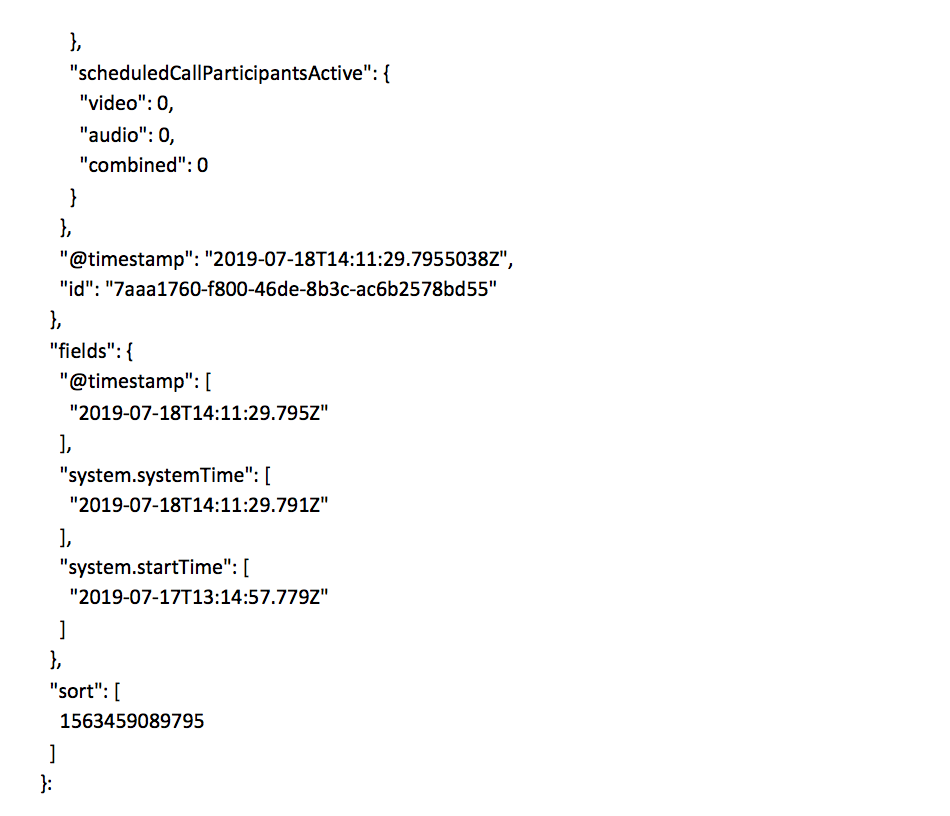
“CallsAndParticipants” breaks down the types of call currently running into Scheduled Calls and Space based Calls. A Scheduled Call is one that has been created via “New Meeting” and runs for a specific duration. A “Space Call” is one that was created by a Participant joining a Space and the Space instantiating a new Call. The total number of Calls and Active Participants are provided as well as the breakdown by type (and within each type, the mix of audio only or video).
Don’t be too alarmed by the fact we’re showing JSON data below. Kibana has really nice auto-complete type-aheads on field names – start typing in the name of the field you’re looking for and Kibana will find it (for example, start typing “bandwidth” and it’ll find matching names and pre-fill with “system.cms.”
Example System State data (JSON format):
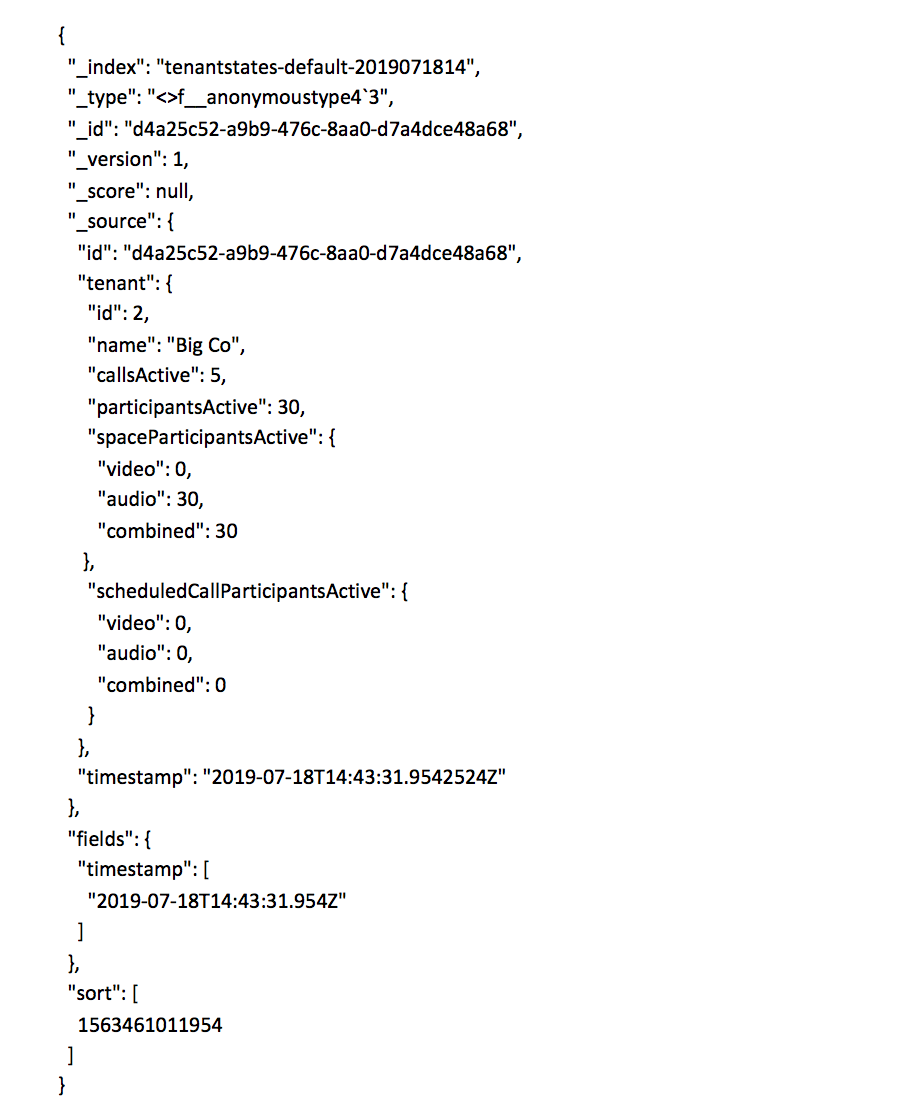
Tenant State
Tenant State provides a snapshot on the state of each Tenant.
Activity on the Tenant is broken down into Active Calls and Active Participants with a further breakdown into Space and Scheduled Call based activity.
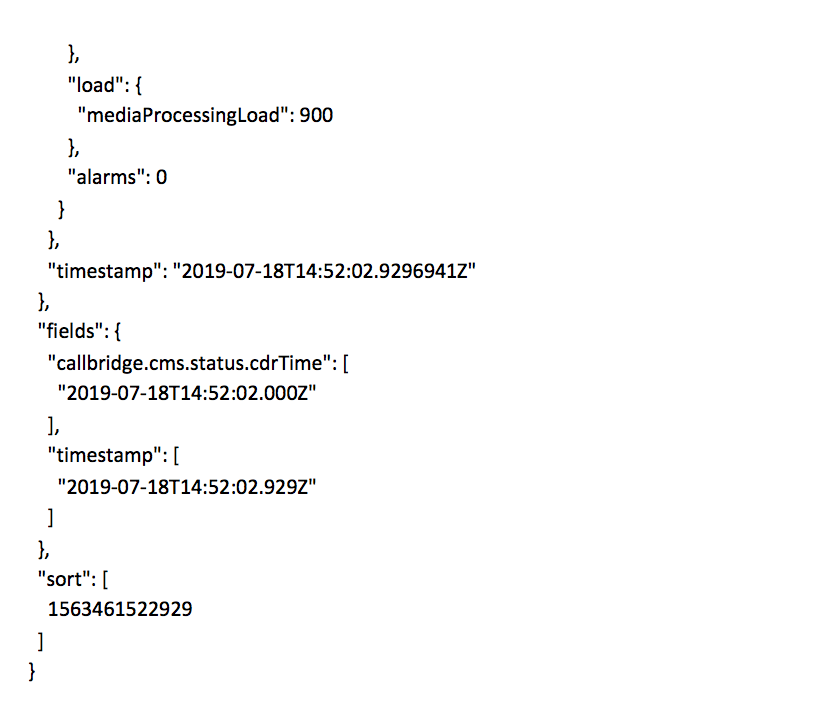
Call Bridge State
Call bridge State provides a snapshot on the state of each Call Bridge.
Please note that “status” is the real-time value. License info updates periodically and can be up to 5 minutes out of date. The mechanism for gathering licensing data changed at CMS 2.6 and therefore this data will change in a future release to match the new mechanisms.
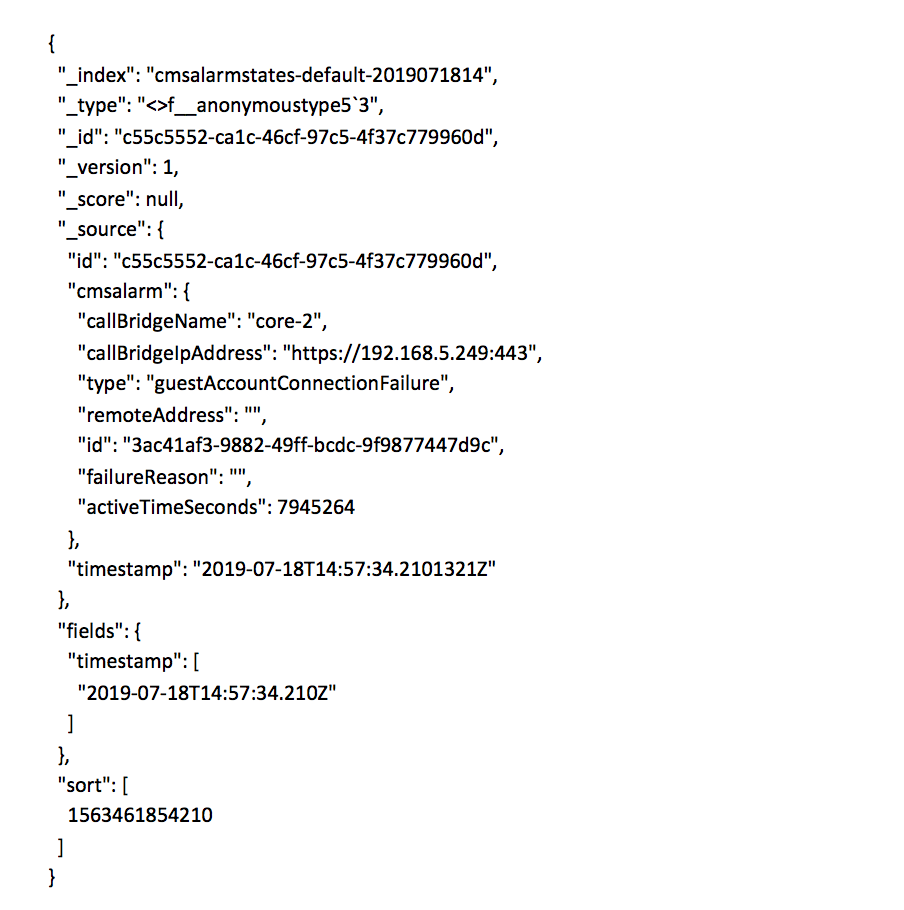
CMS Alarm State
CMS Alarm state provides a snapshot of the Alarm conditions on each CMS Node.
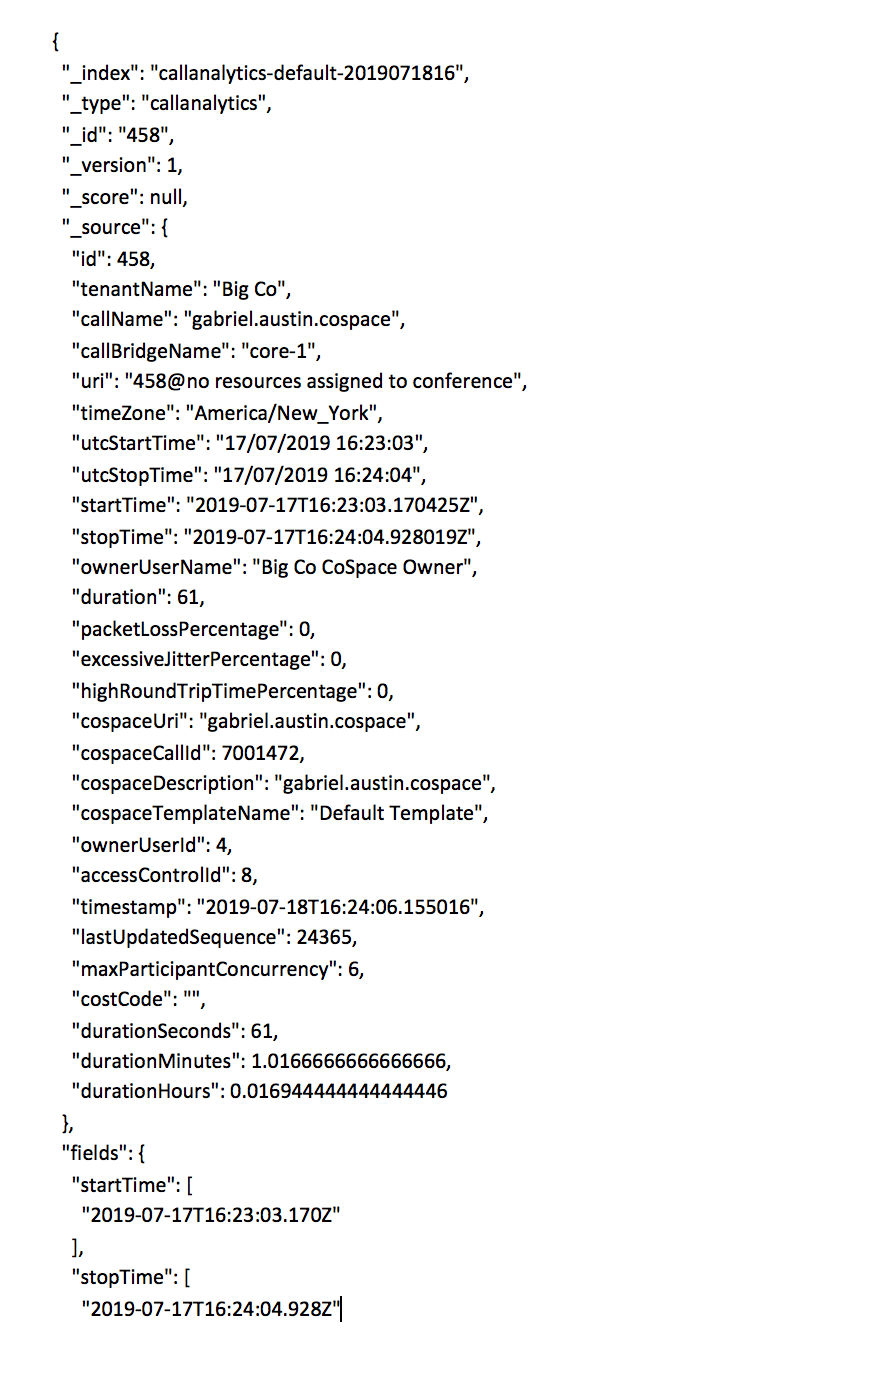
Call Analytics Index
The Call Analytics Index provides details for each Call started on a Space. A Call starts on the Space either as the result of a Meeting being scheduled (VQCM explicitly creates the Call on the Space at the required start time) or automatically by CMS when the first participant calls onto the Space.
A Call may have one or more Participants (Call Legs in CMS terminology). The Call Analytics record does not contain individual Participant records – they are available on the Participant Analytics index. The Call record does, however, contain the maximum Participant concurrency experienced whilst the call executed (the maximum number of Participants in call at any point in time; this is not the same as the total number of participants who joined the call – Participants may join several times because, for example, of connection drops).
UtcStartTime and UtcStopTime is the UTC time the Call started and terminated in a hard-coded UTC format. StartTime and StopTime is the Start and Stop time of the call in ISO formatted time; this is then displayed by Kibana in the viewer’s local time.
PacketLoss, Excessive Round Trip delay and Jitter values are the maximum values across all Participants in the call (in other words, the worst case data from any of the Participants in the call). The values are not the packetloss, high round trip or Jitter percentages (as in “packet loss was 5%”); they are the percentage of time in the call where the associated alarm condition was true (“the Packet loss Alarm was set for 5% of the call time”).
The Participant Records (see note above about Elastic not being a Relational Database) for the call can be found by searching using the “id” key value (in the record below, 458).
Please use the “coSpace URI” field rather than “URI” for the URI.
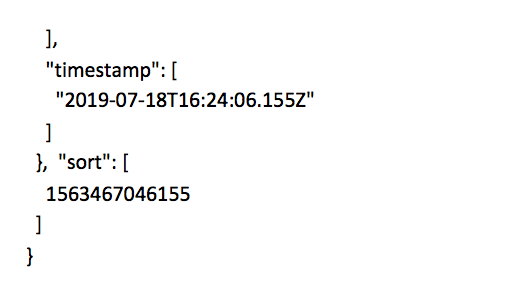
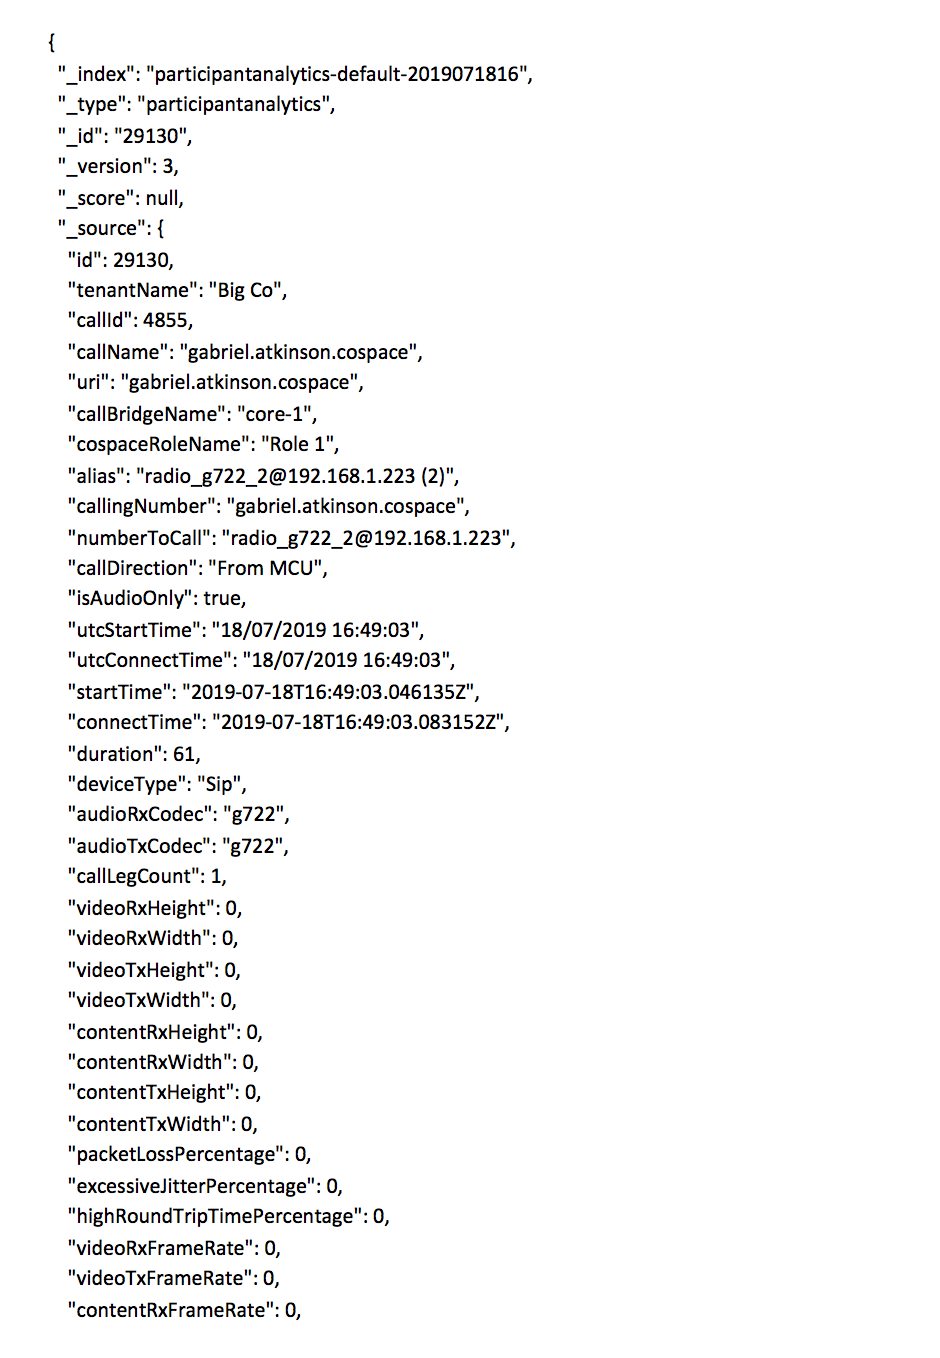
Participant Analytics Index
The Participant Analytics Index provides details for Participant that joined a call on a Space. The data is generated by VQCM based on CDR (Call Data Record) state change events produced by CMS.
The example below is for an audio only Participant and for that reason, details like video geometry details and video codec are not set.
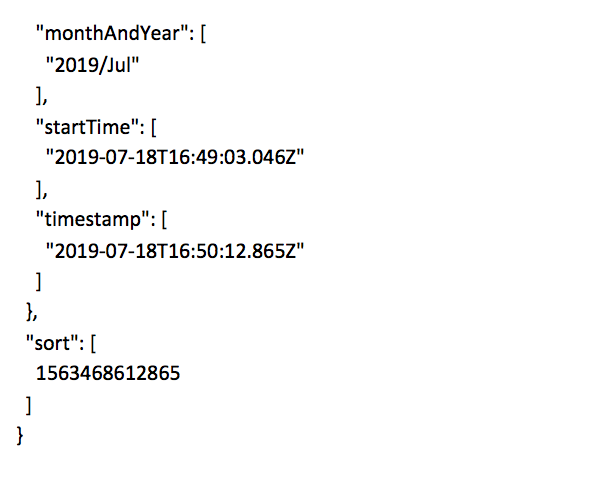
UtcStartTime and UtcStopTime is the UTC time the Call started and terminated in a hard-coded UTC format. StartTime and StopTime is the Start and Stop time of the call in ISO formatted time; this is then displayed by Kibana in the viewer’s local time.
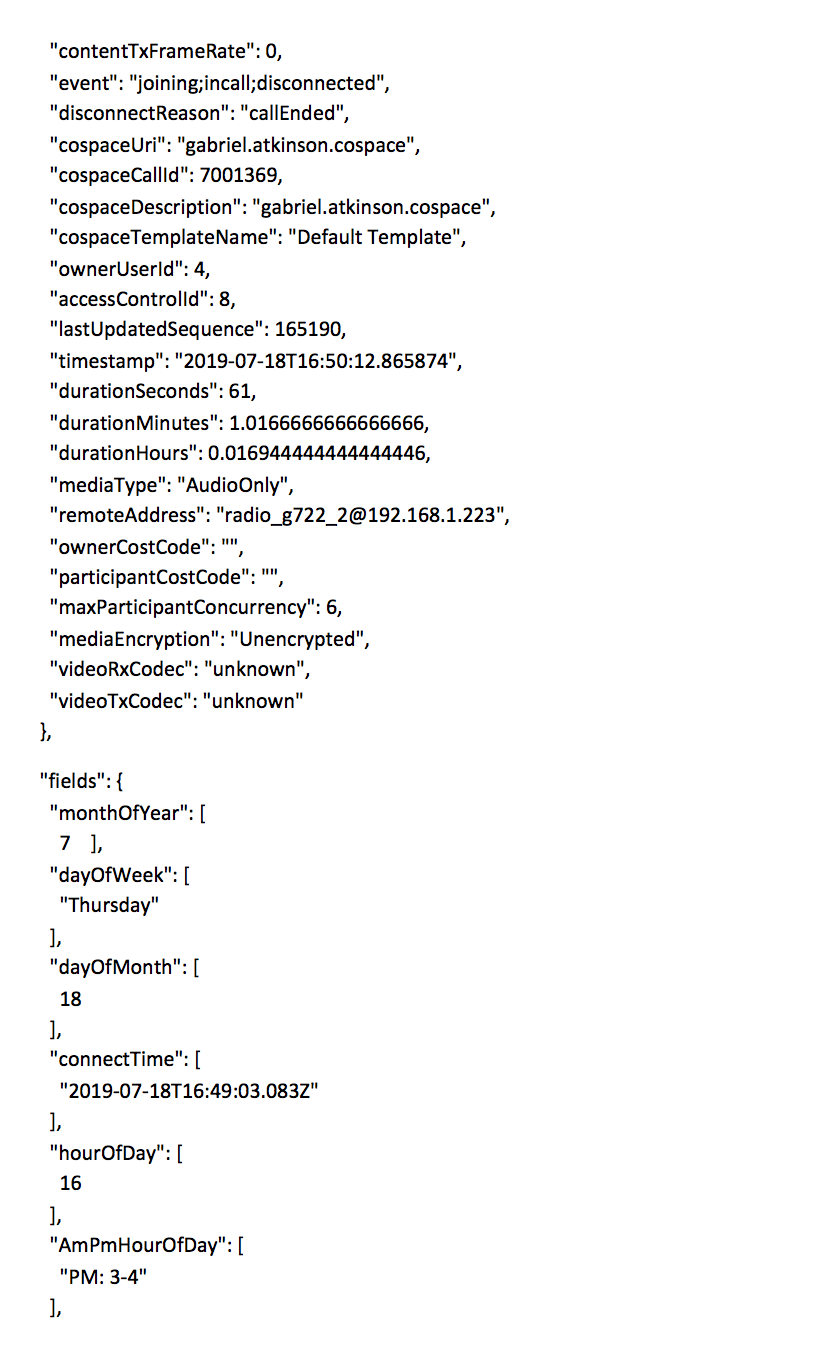
“Calling Number” and “Number to Call” values are retained for backwards compatibility. The replacement values to use are “Uri” (or coSpace URI) and Remote Address. URI is the address of the Space and Remote Address is the address of the device that’s in call with the Space.
CallId is the Identifier of the Call in the Call Analytics Table. coSpaceCallId is the Identifier used to route Participants onto a Space via the IVR.
Events: the states the Participant has taken. Typically, joining, in call, disconnected.
The time the Participant spent connected is obtained via duration, durationSeconds, DurationMinutes or DurationHours. Duration has been retained for backwards compatibility and is the legacy “seconds” value and has been superseded by durationSeconds.
PacketLoss, Excessive Jitter and High Round Trip time are not loss values. They are the percentage of time the Alarm condition was true over the duration of the call.
MaxParticipantConcurrency gives the maximum number of concurrent Participants in the call (it’s included on the Participant record to remove the requirement to access the Call Anaytics index).
Cost Codes
Cost Codes are configured via the "LDAP Configuration" page with values being imported from LDAP/AD.
Each User can be imported with a Cost Code; the Cost Code is associated with any Space created by the User. This is the “Space Owner Cost Code”.
A default Cost Code can be defined on each Tenant; this value will be used if no Cost Code is assigned during the Import Process. The Tenant Cost Code will be applied to any Spaces “Discovered” on CMS for the Tenant that were not created by VQCM.
Participant Cost Codes are associated with Endpoints; Endpoints can be created automatically for each User as part of the Import process or are created at run-time as new Participants are added to calls.
Each Participant in a Call will therefore either be based on an Endpoint associated with a User (and therefore pick up the User’s Cost Code) or will be a new/discovered Participant. New/Discovered Participants will be assigned the Cost Code of the owning User of the Space.
The Endpoint Importer tool has been updated to support Cost Codes.
Legacy records and “Missing” values
Participant and Call records that used to only contain “duration” (seconds) values will, from 3.1, also contain DurationHours and DurationMinutes values. When producing reports from historical records, these new values will not be present.
Be aware that some of the dashboards might therefore contain results that include a subset of records with DurationHours/Minutes values. You might, therefore, see values that initially don’t look right in that the reported number of duration (seconds) doesn’t match the duration in hours or minutes. This is because the data contains a mixture of new and old records.
The MediaType value was added in 3.1; you might therefore see “Missing” for the MediaType value from earlier records.
Participant RemoteAddress, CallingNumber and NumberToCall
The RemoteAddress value was added in 3.1 to simplify the identification of Participants. For each Participant record, CoSpaceURI identifies the Space URI and RemoteAddress identifies the address of the device. RemoteAddress will appear as “Missing” in records generated before 3.1.
Before the addition of RemoteAddress at 3.1, we had CallingNumber and NumberToCall. Depending on whether the call was an outbound call from the MCU(CMS) or an inbound (to the MCU/CMS), the CallingNumber would either be the Space URI (an outbound call from a Space on CMS) or CallingNumber would the device number (Because it was calling into a Space).
This made reporting awkward (and difficult to explain); RemoteAddress simplifies things substantially. We’ve made NumberToCall and CallingNumber available in some of the filters to enable searching of legacy records.
Kibana filter changes
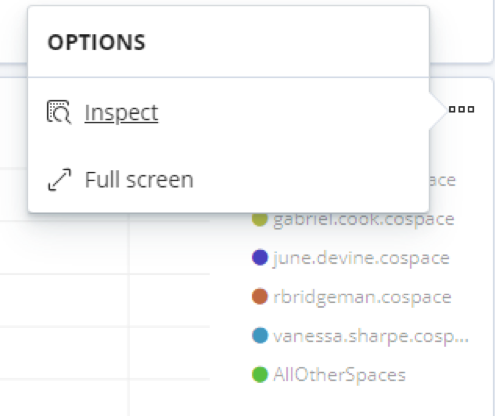
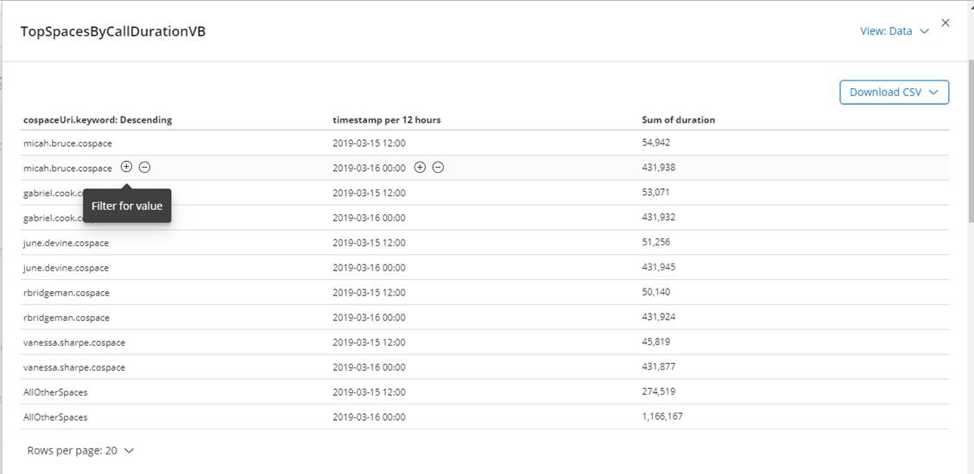
Previous versions of Kibana allowed values to be filtered via the +/- icons. They can still be used on searches but the model has changed on charts:
It now works as follows: