How to create Watchers in Analytics
Introduction
This document describes the steps to follow to create a simple and advanced watcher, and how to link an action to that event.
Step 1: Get a Elastic Stack Enterprise license
The watchers are part of the advanced features locked behind the Enterprise license, and therefore it is needed before doing anything with watchers.
Please contact VQ to discuss details.
Step 2: Configure actions
When the watcher triggers, you can choose to add an action to send a notification that an event was fired. You can then edit the message you want to send, but first, you need to configure the actions.
Currently we only have implemented the method to configure SMTP accounts for sending emails on the VM. If you want to use one of the other actions, please contact support@vqcomms and we can help you configuring it manually.
Email action:
Documentation for email notification settings
Documentation for different email profiles
To configure the SMTP server you want to use and the email account, we have created an “Ansible Playbook” that you currently have to run manually from the VQCM VM. In the future, we will add a section in the VQCM Admin web interface to handle this configuration.
You can either run those commands from the Emergency Shell of the VM (skip the SSH authentication and the admin privileges if you do so), or SSH into the VM from a terminal or tool for Windows like PuTTY.
You will have to enable SSH access from VQCM Admin, and create a SSH user, as shown on the following screenshot:
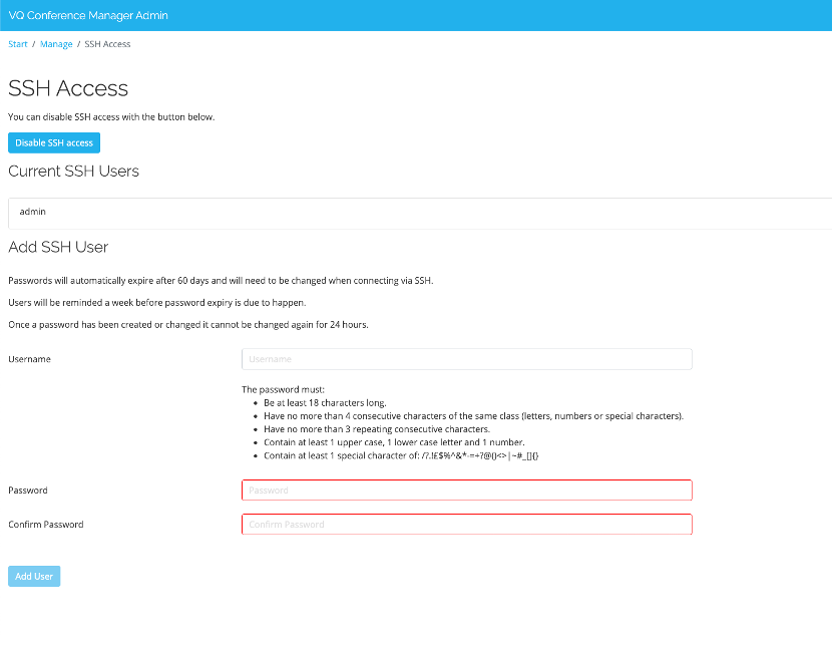
Figure 1: Enable SSH access to the VQCM VM
You can then SSH into the VQCM VM by using those credentials to authenticate:
ssh <user>@<CM_FQDN_OR_IP>
We also need to get root privileges, by running the following command. You will need to enter the root password:
sudo -i
You now need to move to the correct directory:
cd /vq/ansible/playbooks/deploy-eck/
You will have to edit the config file by running the following command:
nano roles/create-smtp-accounts/defaults/main.yaml
NOTE: Alternatively, if you don’t want to use terminal based editors, you can edit the file outside of the VM and copy it back in.
For help on how to use nano, see https://www.nano-editor.org/dist/latest/cheatsheet.html
NOTE: This is a yaml file, and you should make sure to keep the structure / indentation as found in the template file, as it is an important part of the yaml format. Make sure to use spaces to do indentations, and not tabulations. The following website should help you to fix any formatting problems:
This config file will look like this by default:
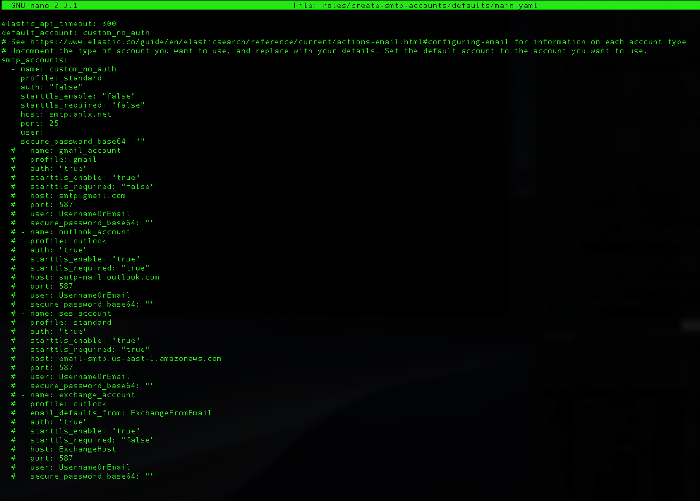
Figure 2: YAML configuration file opened in Nano
You can uncomment the type of account you want to use, and fill in your details. You can have multiple accounts defined at the same time, but the default one will be used in most cases (unless you specify otherwise in the advanced watchers).
Once you are happy with your config file, Save and Exit.
You can now run the Ansible Playbook to create the smtp accounts by running:
ansible-playbook playbook.yml --tag="create_smtp"
If you want to delete the SMTP accounts (before adding/modifying new accounts for example), you can run the following command:
ansible-playbook playbook.yml --tag="delete_smtp"
The output should look similar to the following screenshot, and shouldn’t report any failure. If there is, please contact support@vqcomms.com
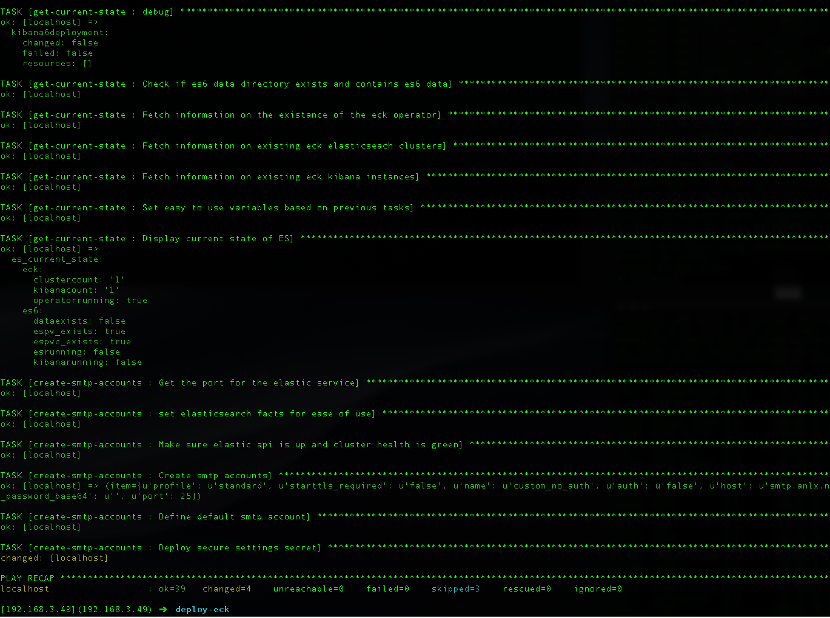
Figure 3: Example output of the Ansible playbook
Your SMTP accounts are now configured, and you can test them by sending a test email (see further below).
Step 3a: Create a simple Watcher
Go to the Management ->Stack Management ->Alerts and Insights ->Watcher tab, and from there you can create a new watcher.
You can use the “Create Threshold Alert” option, where you will have a simple UI guide you to create the watcher.
You can also use the “Create Advanced watch” option, where you can customize your watcher in details, but you will have to edit the raw JSON definition.
A watcher is composed of 4 parts:
- Input: Loads data into the watch payload
- Trigger: Determines when the watch is checked
- Condition: Controls whether the watch actions are executed
- Actions: Specifies what happens when the watch condition is met
Let’s take the example of creating a watcher that will monitor the state (online/offline) of our Callbridge in VQCM, and send an email if it goes offline. We will first create a basic watcher using the UI, and then edit it to add a throttle.
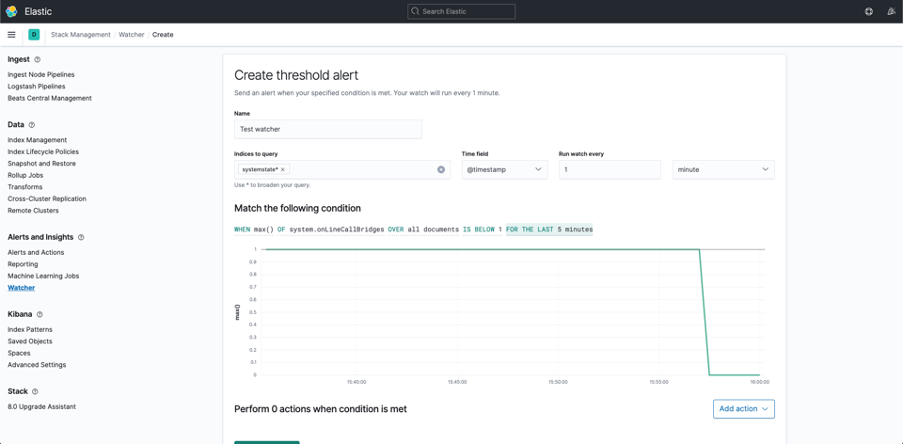
Figure 4: Creating a watcher using the UI
On this interface, you can find the 4 components of a watcher mentioned above:
- You will have to specify which indices you want to query, which represent the data the watcher will monitor. For this example, the “systemstate” index pattern contains the information about the number of online Callbridges known to VQCM.
- You will have to select a schedule for the watcher, to decide how often it triggers. We’ll make it run every minute.
- You can then create a condition by changing the keywords and values from drop down menus. The panel below will update with a visualization of the data based on those conditions, and will show the threshold that will need to be met to cause an action (or actions) to be executed.
-
You can then select which actions will be executed from a list of predefined actions, like email or slack notification. Those will need to be configured ahead of time, see Step 2.
You can include data from that watcher instance in the message sent with the action, for example by email. This available data is accessible using the Mustache scripting language, and is described here. This can allow you to enrich the alert message with useful data, for example, the time where the watcher was triggered (see example below).
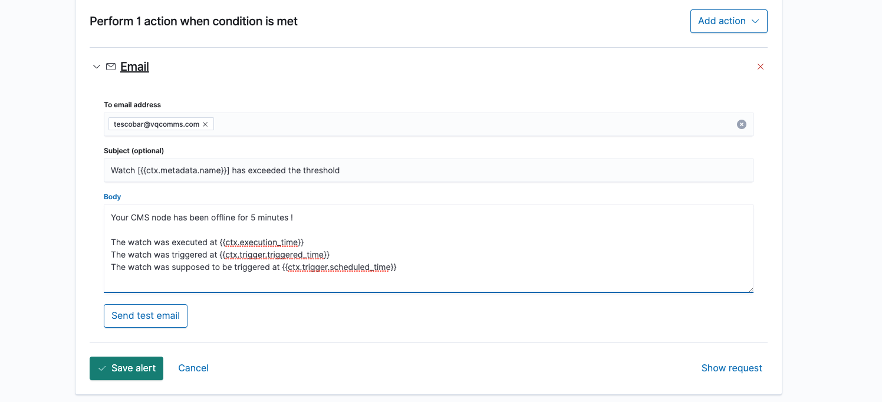
Figure 5: Email template for the watcher
You can validate the Email Template and the email account configuration by sending a test email.
Once you are happy with the watcher, you can click “Save alert”.
Step 3b: Create an advanced watcher
Documentation for acknowledgement and throttling
Advanced watchers offer more possibilities and customization, but require you to edit the JSON file describing the watcher manually. Additional functionalities include throttling, attachments for your email and additional use of your watcher data.
We will now see how to create an advanced watcher from the first watcher we created. We will add throttling to prevent it from sending too many emails, and a link to a dashboard around the time the watch was triggered.
First of all, you will want to get the JSON file from the first watcher as a starting point. To do that, you can click the “show request” button at the bottom right (see screenshot), and copy the JSON in the PUT request (starting with the first ‘{‘ character).
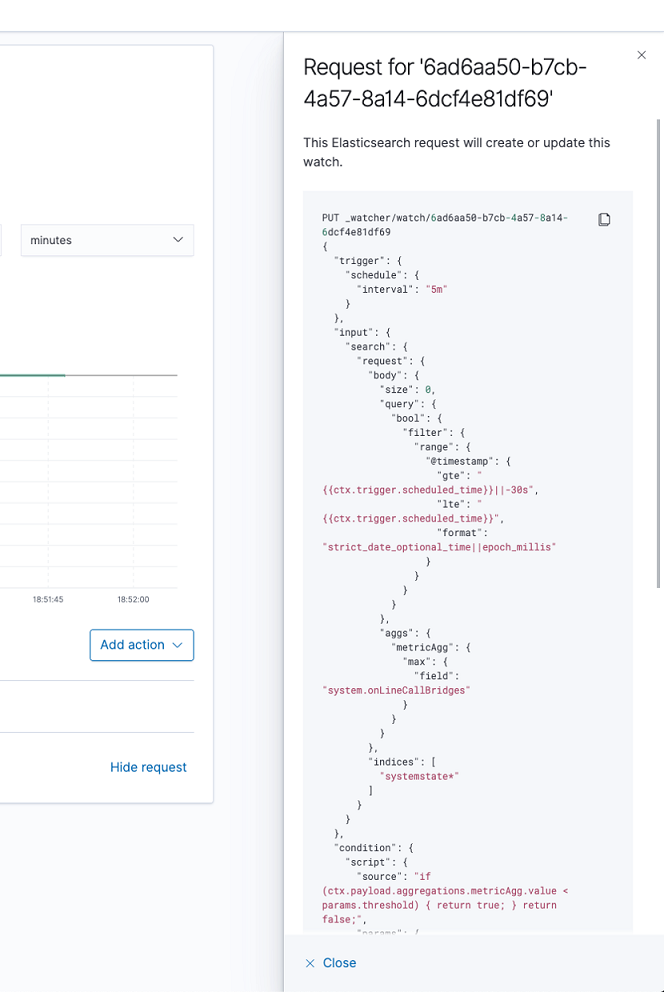
Figure 6: JSON definition of the simple watcher
You can now create an advanced watcher, and replace the default JSON file by the one copied from the simple watcher we created.
To add throttling (for 15 minutes in this example), simply add the following line:
"throttle_period": "15m",
You can define it on a watcher level by adding the line just above “actions”, or at the action level (different throttle for each action) by adding it in each action’s definition. This will prevent the watcher from executing multiple times on the same event. It should look like the following screenshot:
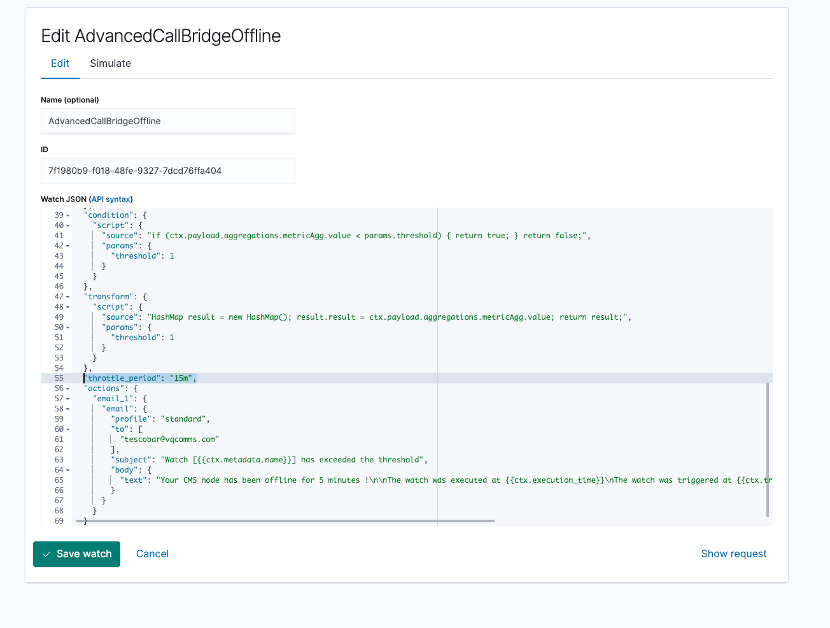
Figure 7: Adding throttling to the advanced watcher
You can also include a link to a relevant dashboard, and change the time window dynamically to focus on the moment the watch was triggered.
First of all, you need to select a dashboard that you want to link to the email. You can use one of the ones available, or create your own. You should make sure that the time window selected is using Absolute times, in order to be able to edit those in the link. You will then need to get the link from the share options at the top right of your browser, and copy it somewhere for later (see screenshot):
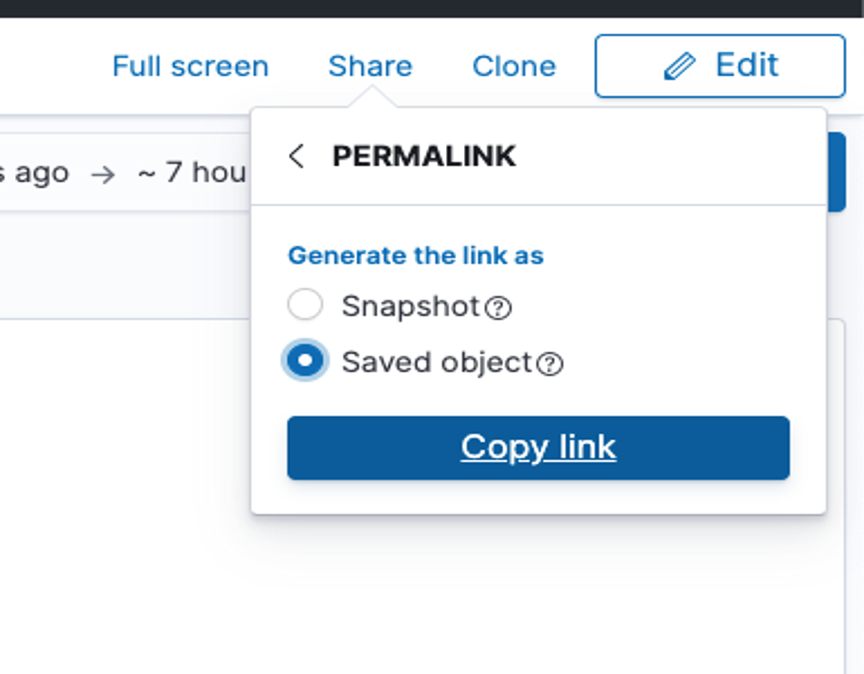
Figure 8: Getting a link to the dashboard
Now, before adding the link to the dashboard, we need to calculate the new “from” and “to” timestamps to use in that URL. To do so, we will have to use a small painless script to transform the payload of the watcher (result of its search) to create a new one that contains variables and data we can use in the email template:
  "transform": {
    "script": {
      "source": "def[] items; def fromTime = ctx.execution_time.plusSeconds(-300); def toTime = ctx.execution_time.plusSeconds(300); items = new def[] {fromTime,toTime}; return items;",
      "lang": "painless",
      "params": {
        "threshold": 1
      }
    }
  },
We have now created an array containing 2 variables, defining a time window that starts 5 minutes before the watch was executed, and ends 5 minutes after.
These variables in the array can now be accessed in the email template with the following syntax (the index starts at 0):
{{ctx.payload._value.<index_in_the_array>}}
Our data is now ready to use, we can create the body of the email itself. By copying it from the simple watcher, we have a “plain text” email body. However, we have found that this can cause issues when including the link, as it will be up to the receiver app to format it into a link.
The better way of doing this is to use an HTML body, where you can add a hyperlink by using the <a> tag:
<a href="url">link text</a>
In that hyperlink, we can now use the variables above to replace the “from” and “to” time. We will have to surround them with the following tags to handle URL encoding:
<#url><text></url>
We end up with an email action looking like the following:
  "actions": {
    "email_1": {
      "email": {
        "profile": "standard",
        "to": [
          "tescobar@vqcomms.com"
        ],
        "subject": "Watch [{{ctx.metadata.name}}] has exceeded the threshold",
        "body": {
          "html": """
<html>
<body>
<p>Your CMS node has been offline for 5 minutes !</p>

<p>The watch was executed at {{ctx.execution_time}}<br>
The watch was triggered at {{ctx.trigger.triggered_time}}<br>
The watch was supposed to be triggered at {{ctx.trigger.scheduled_time}}</p>

<p>Find here the dashboard with the logs around the time of the trigger : <a href="https://kibana.thomastest.vq.lab/app/dashboards#/view/9b699dd0-4a1c-11e8-9e2e-4178faa10783?_g=(filters%3A!()%2CrefreshInterval%3A(pause%3A!t%2Cvalue%3A0)%2Ctime%3A(from%3A'{{#url}}{{ctx.payload._value.0}}{{/url}}'%2Cto%3A'{{#url}}{{ctx.payload._value.1}}{{/url}}'))">Dashboard</a></p>

</body>
</html>
"""
        }
      }
    }
  },
Here is an example email produced by the watcher when we turn off the Callbridge on purpose:

Figure 9: Example of an email sent by the watcher
You can find an example of the full JSON for the watcher described here in the appendix below.
{
  "trigger": {
    "schedule": {
      "interval": "1m"
    }
  },
  "input": {
    "search": {
      "request": {
        "search_type": "query_then_fetch",
        "indices": [
          "systemstate*"
        ],
        "rest_total_hits_as_int": true,
        "body": {
          "size": 0,
          "query": {
            "bool": {
              "filter": {
                "range": {
                  "@timestamp": {
                    "gte": "{{ctx.trigger.scheduled_time}}||-5m",
                    "lte": "{{ctx.trigger.scheduled_time}}",
                    "format": "strict_date_optional_time||epoch_millis"
                  }
                }
              }
            }
          },
          "aggs": {
            "metricAgg": {
              "max": {
                "field": "system.onLineCallBridges"
              }
            }
          }
        }
      }
    }
  },
  "condition": {
    "script": {
      "source": "if (ctx.payload.aggregations.metricAgg.value < params.threshold) { return true; } return false;",
      "lang": "painless",
      "params": {
        "threshold": 1
      }
    }
  },
  "actions": {
    "email_1": {
      "email": {
        "profile": "standard",
        "to": [
          "tescobar@vqcomms.com"
        ],
        "subject": "Watch [{{ctx.metadata.name}}] has exceeded the threshold",
        "body": {
          "html": """
<html>
<body>
<p>Your CMS node has been offline for 5 minutes !</p>

<p>The watch was executed at {{ctx.execution_time}}<br>
The watch was triggered at {{ctx.trigger.triggered_time}}<br>
The watch was supposed to be triggered at {{ctx.trigger.scheduled_time}}</p>

<p>Find here the dashboard with the logs around the time of the trigger : <a href="https://kibana.thomastest.vq.lab/app/dashboards#/view/9b699dd0-4a1c-11e8-9e2e-4178faa10783?_g=(filters%3A!()%2CrefreshInterval%3A(pause%3A!t%2Cvalue%3A0)%2Ctime%3A(from%3A'{{#url}}{{ctx.payload._value.0}}{{/url}}'%2Cto%3A'{{#url}}{{ctx.payload._value.1}}{{/url}}'))">Dashboard</a></p>

</body>
</html>
"""
        }
      }
    }
  },
  "transform": {
    "script": {
      "source": "def[] items; def fromTime = ctx.execution_time.plusSeconds(-300); def toTime = ctx.execution_time.plusSeconds(300); items = new def[] {fromTime,toTime}; return items;",
      "lang": "painless",
      "params": {
        "threshold": 1
      }
    }
  },
  "throttle_period_in_millis": 900000
}
Step 3c: Create a scheduled export Watcher
Documentation for email attachments
You might also have a need for a watcher that triggers on a schedule, for example for sending a monthly report.
This can be done in the advanced watchers, by editing the JSON definition of the watch. All the settings mentioned above are still valid, but we will simplify the watcher, as it doesn’t need a complex input or condition.
The watcher will be constituted as follow:
-
Trigger: On a schedule, defines how often the actions (email) are executed. Example: 30d
-
Input: Could be left empty, as we do not need one. Can also be set to “simple” to contain data for the email templating. In this example, we’ll set the name of the recipient
-
Condition: Always true. Makes sure the action will be taken each time the watch is triggered
-
Actions: Send an email (as seen previously) with an attachment. This can be a PDF/PNG export from the dashboard “export” feature
You will need the “POST URL” of the dashboard you want to be exported and sent via email. You can find this on the Dashboard page, in the “Share” menu:
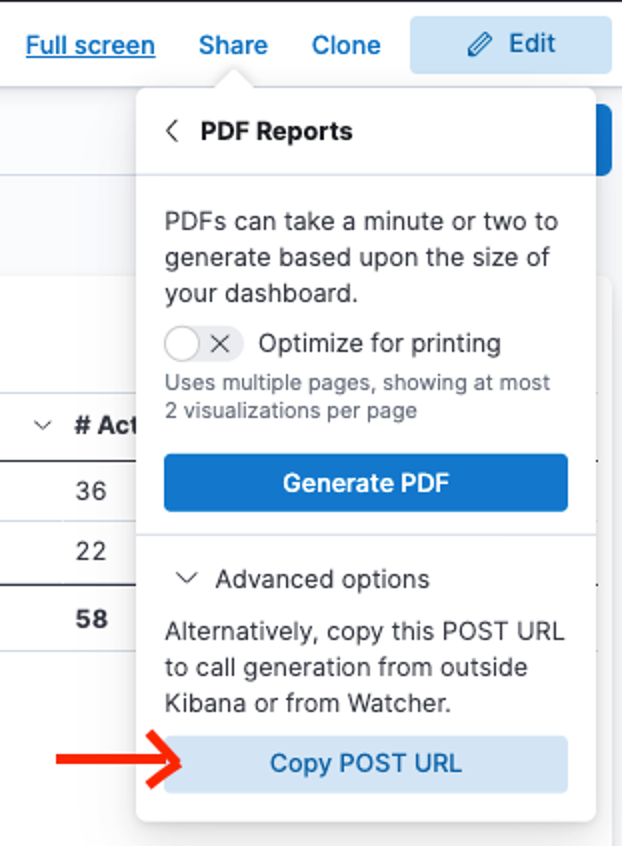
Figure 10: Where to find POST URL
You can then copy this in the “URL” section of the “reporting” attachment. Note that you can use both the PDF or PNG option with the same method, as seen below.
Important: You will have to replace the beginning of the URL, “https://<YourKibanaFQDN>/api/…” by “http://elastic-kb-http:5601/api/…”
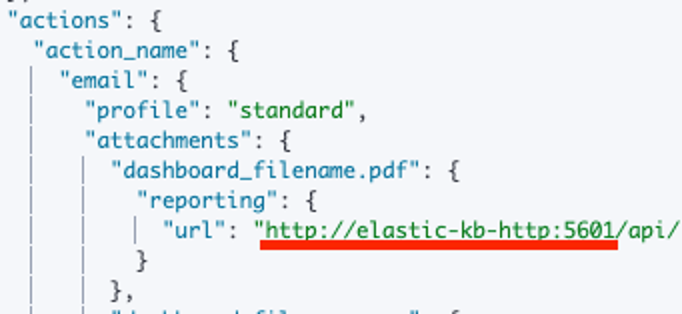
Figure 11: POST URL after being edited
Please find below an example of the full resulting watcher:
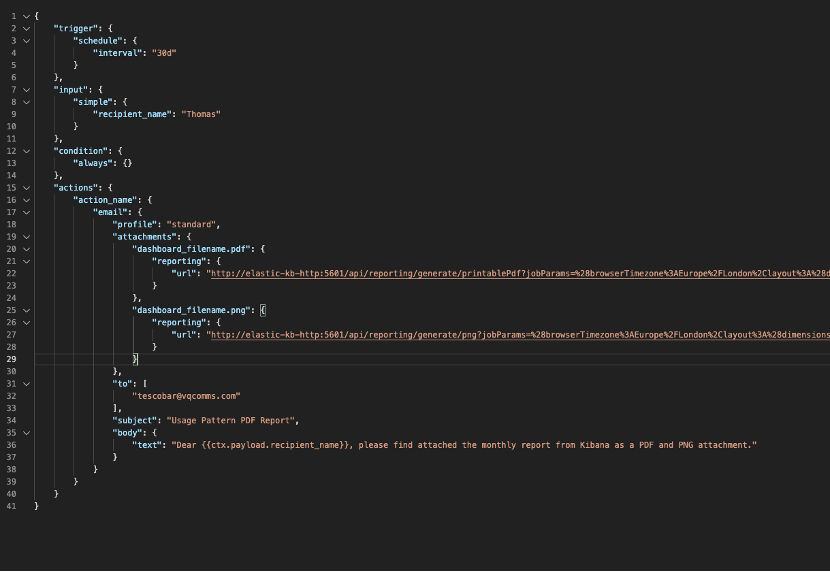
Figure 12: Example of the full monthly report watcher